A strange week for markets having not really advanced, but importantly, have worked off their massive overbought reading.
Leadings stocks are resting or consolidating a bit while some remain strong.
The bottom line remains that we are in the thick of the nice run into years end and new buy points are setting up as I type.
Metals were consolidating below ket technical levels most of the week until Friday when they saw a nice move higher.
My theme last week was that weekly charts are key here and that was my thought all week to subscribers.

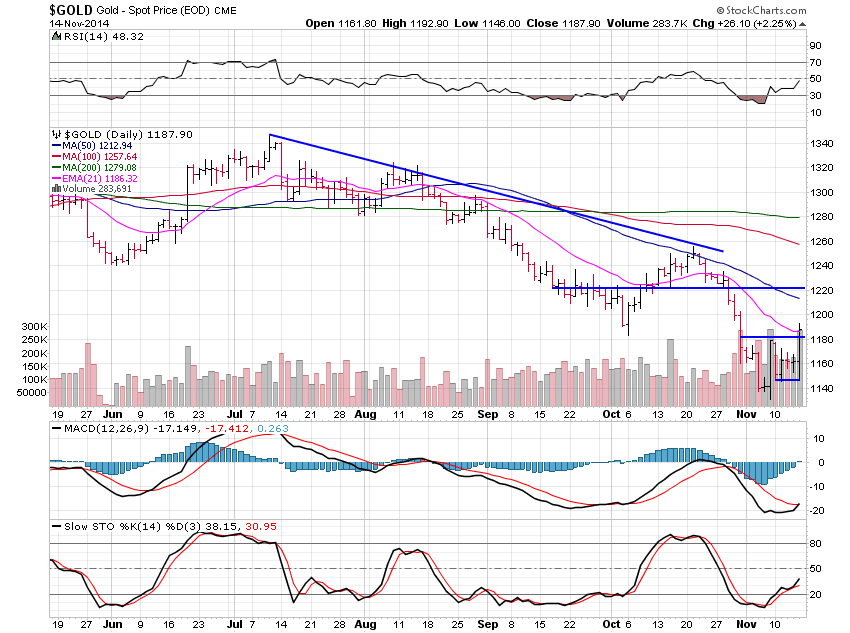
Gold gained only 0.78% for the week but did so in spectacular last minute fashion.
Markets always try to shake out and get as many people on the wrong side as possible and that is what the gold market did this week.
All week I told subscribers that gold did look fine and that I still thought a temporary low was in place, even though gold was a bit on the weak side.
Gold had to close the week above $1,180 or risk moving lower right now.
Waking periodically throughout Thursday night to check prices, gold was lower by $10 or more and that continued into the US open.
I thought I was wrong, as often happens, but then gold began to reverse and run hard to the upside finishing with strong volume above the significant $1,180 level.
That was lucky, but, as I said, the markets try to make you doubt yourself constantly.
We are long gold via a gold miner ETF and it looks great for a nice move higher now but I won’t overstay my welcome.
Gold now has the all clear to move to $1,220 where I’ll be looking to take my gains perhaps.
All week I was getting emails telling me that gold was moving lower and all the “reasons” for it.
If I say gold is going down, emails pour in telling me the opposite and vice versa. I just can’t win in that game, but I do win in the stock game which really matters.
I do use emails as a part of my sentiment indicator but I really don’t need to since the chart really does tell all, but it does make me chuckle how the same people seem to always be on the opposite side of me.

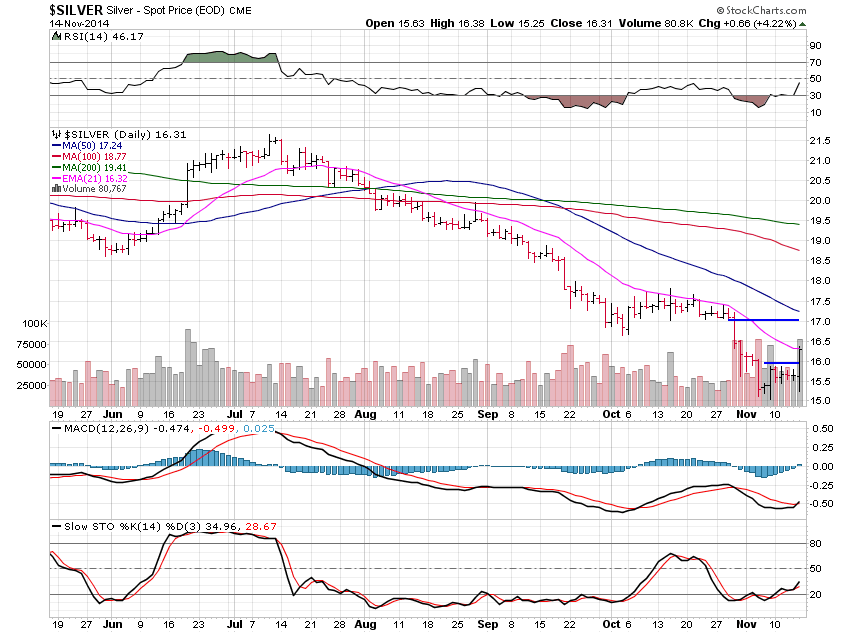
Silver moved higher by 3.13% after spending the week consolidating.
A great move that now clears the way for a hit of $17.

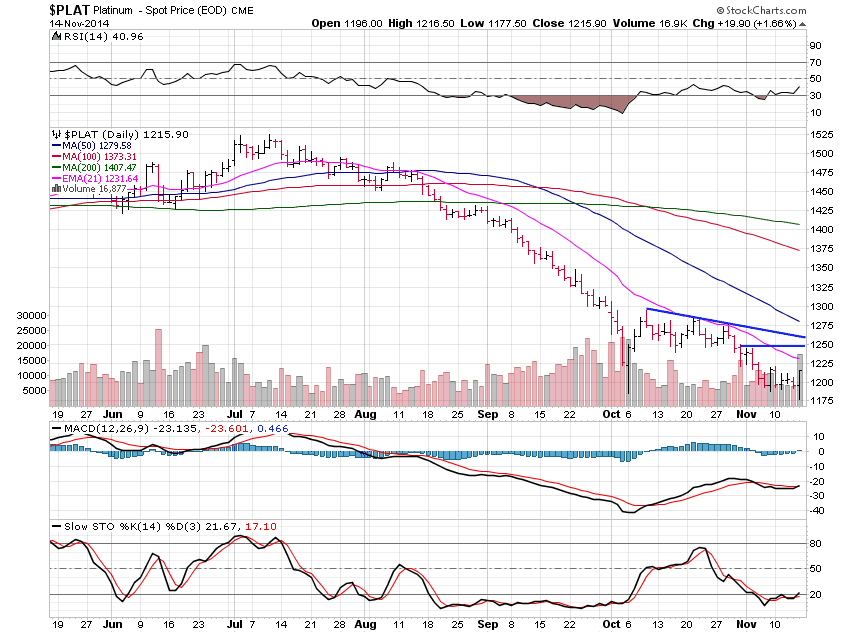
Platinum lost 0.16% this past week but is now on the way to $1,250.
After $1,250, $1,275 will pose a bit of resistance and then there really isn’t much holding platinum back from moving up to $1,400.
I am considering a trade in this but I’m pretty busy with other trades at the moment so I’m not sure I’ll take it.

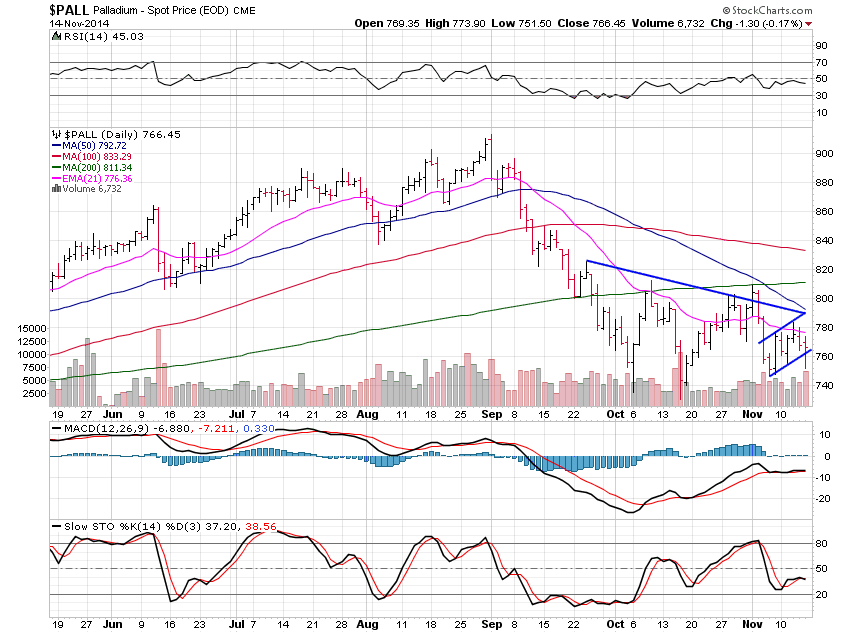
Palladium lost 0.91% this past week and doesn’t look super but the fact that it did try to break below the bear flag and failed is very positive.
Palladium has been the last to fall in terms of metals for a long time now but at this moment it looks the worst!
It will rise though with gold and silver regardless of how the chart looks.
Don’t let the market take your money, study and learn the game and I can help you with that.