
We’re revisiting treasury bonds even though they were the subject of our previous post. The resistance in the iShares 20+ Year Treasury Bond ETF (NASDAQ:TLT) served well as a backstop for a nice short trade. Now TLT may be developing a similar setup.
We’re watching some key resistance levels and also using an Elliott wave rule of thumb to forecast a further decline in bonds and TLT from near the current resistance area. Our level of 120.10 has already been tested and initially rejected, although there’s backup resistance at 123.35 and near the lower main boundary of the channel drawn on the chart.
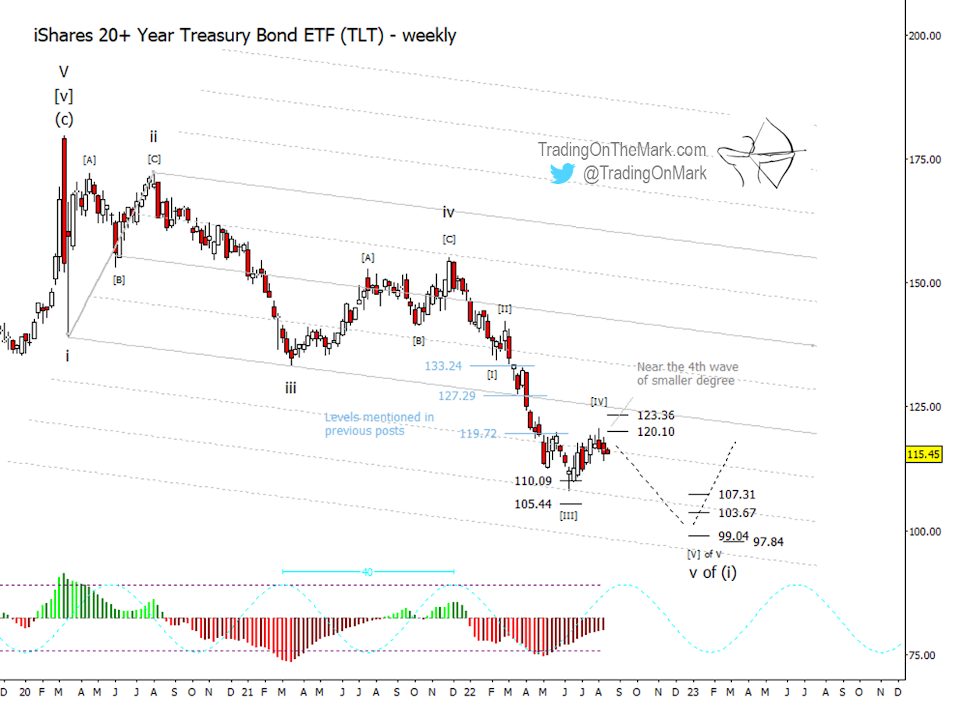
The rule of thumb says that a fourth wave will often test the edge of the previous fourth wave of one lesser degree. In the present case, TLT rose to test near the prior small high near the 119.72 price level that was active earlier. If you count the small waves down from the top of wave [II] to the bottom of wave [III], you’ll see five smaller sub-waves, and the price has recently tested near the high of the fourth of those sub-waves.
Next, we’d like to see a push toward supports at 107.31, 103.67, and the area near 99.04 to 97.84. The next channel harmonic line could also act as support if tested.
The 40-week price/time cycle has inflections in mid-September and early February, but there are other competing timing signals. Although we’ll be watching price action near those dates, we assign greater importance to the price levels on the chart.