Last week, I thought back to an article that Warren Buffett wrote a few months before the great internet bubble of the 1990s finally burst. It’s not for nothing that they call Buffett the Oracle of Omaha, and alas, I could have saved myself a lot of heartburn had I listened to him 16 years ago.
Today, I’m going to take a look at a valuation metric that Buffett (Berkshire Hathaway Inc (NYSE:BRKa)) calls “probably the best single measure of where valuations stand at any given moment.” And that would be the ratio of Total Market Cap of U.S. stocks as measured by the Wilshire Total Market Index to U.S. GDP.
The thinking here is pretty straightforward. Over the very long term, the value of the stock market should move more or less in line with the economy. Individual companies can crowd out their competition, but the value of the market in aggregate should roughly track the value of the economy in which those companies operate.
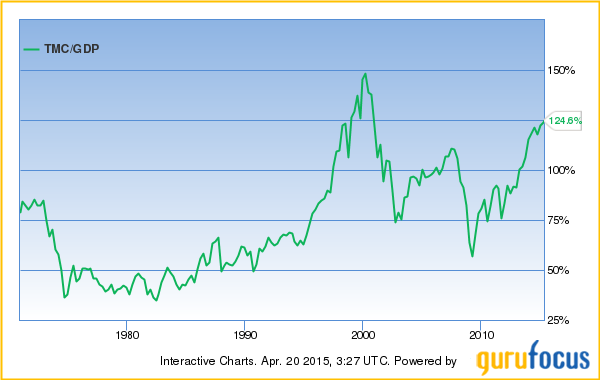
So, with that said, let’s take a look at Mr. Buffett’s indicator, courtesy of data site GuruFocus:

Right now, the U.S. stock market is worth about 125% of the U.S. economy. In a vacuum, this is a meaningless number, but it can be illustrative to see it in the context of a long-term chart. As you can see, today the market is roughly twice as expensive as it was in the early 1990s. And it’s only about 25% below the levels of the 2000 dot-com-mania peak.
In other words, Warren Buffett’s favorite macro valuation tool is screaming that U.S. stocks are nearing bubble territory.
Now, to be fair, there are quite a few moving parts here. As I wrote last week, corporate profits as a share of GDP are at all-time highs. Capital has been taking a larger and larger piece of the economic pie from labor for the past three decades, so it makes sense that the value of their equity would be near historic highs as well. And low interest rates have the effect of pushing up asset values across the board.
But while both of those factors might help to explain why stock valuations have grown to become this large relative to GDP, neither gives me much confidence for the future. Corporate profits are well above the levels that Buffett believed to be sustainable, and the massive revaluation of the market due to falling bond yields has already happened. Bond yields cannot go much lower than they are today, meaning that the relative value trade here has already run its course.
None of this means a crash is imminent, course. Stocks can go from expensive to even more expensive. It happens all the time. But if nothing else, this tells us that blindly throwing new money into an index fund right now is a bad idea. This is a time to stay tactical, focus on income, and look to buy pockets of value as you see them.
