The pause by gold gave way to selling pressure yesterday, spurred to a degree by the post-Monday‘s trading action. As both metals declined by around 2.5%, this move probably appears overdone to more than a few. I called it a knee-jerk reaction before yesterday‘s close. In today‘s analysis, I‘ll demonstrate why precious metals investors shouldn‘t be afraid of a trend change – none is happening.
Let‘s dive into the charts (all courtesy of www.stockcharts.com).
Gold In Spotlight
The yellow metal is attempting to stage a recovery – a modest one thus far as it has been rejected at $1,810 earlier. How disappointing is that?
We‘ll see at the closing bell (my assumption is that the bulls will prevail today comfortably), but the implications of the moves thus far doesn‘t change my thesis of a break higher from the five-month long consolidation in the least. The technical (not to mention fundamental) factors propelling it higher are still in place.
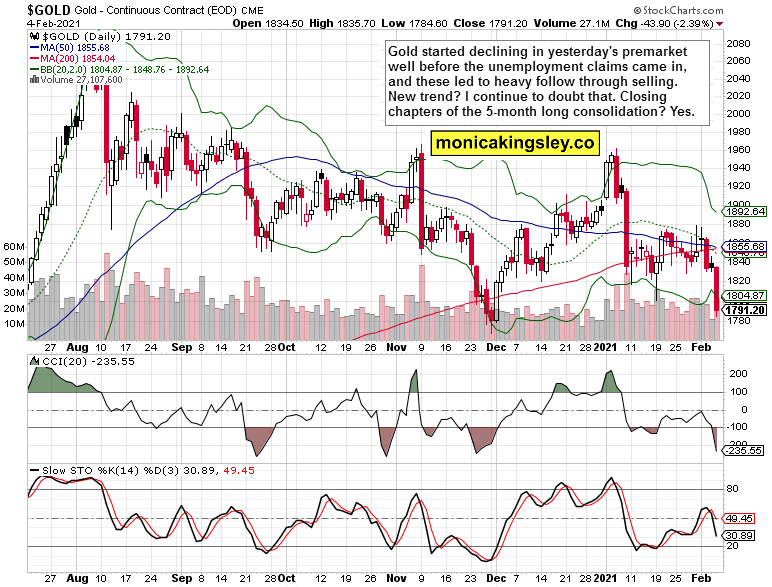
The caption says it all – we‘re in the closing stages of the prolonged consolidation. Prices will rebound next, as so many preceding sizable red candles had trouble attracting follow through selling. And yesterday‘s candle is in a technically more difficult position to achieve that. The moving averages aren‘t seriously declining, and I look for the death cross (50-day moving average puncturing the 200-day one) to fail relatively shortly.
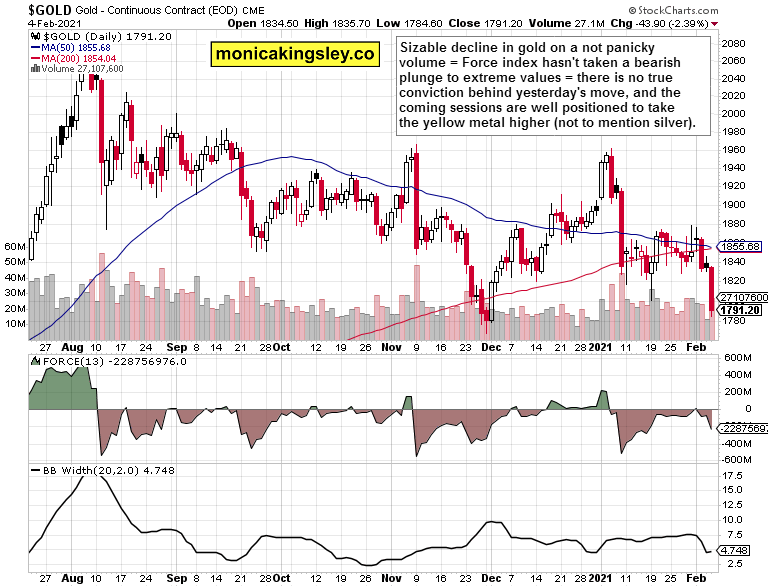
The Force index in gold agrees that we aren‘t seeing a really serious push to the downside here. Look at the start of 2021. How deep it went back then – we‘ll carve out a nice bullish divergence as I look for gold to get serious about turning up. Yes, the Force index won‘t decline as low as in early January.
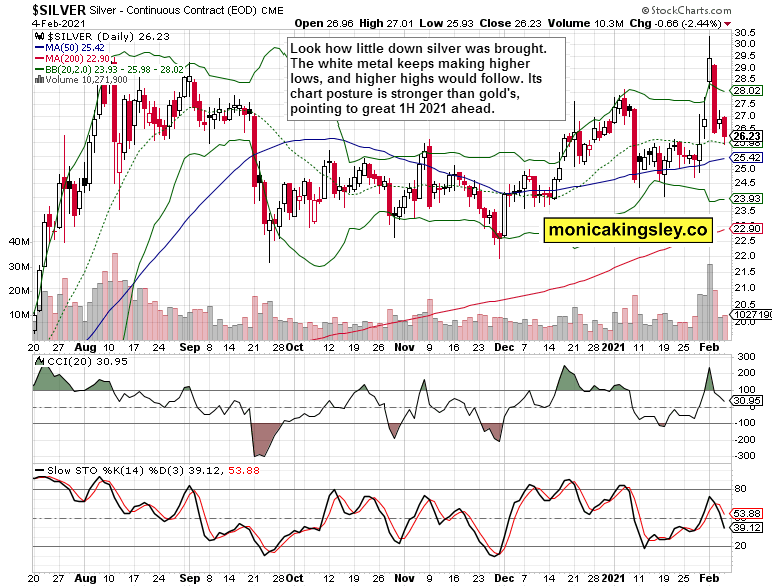
Silver didn‘t yield all that much ground as the short squeeze got squeezed. The chart is still bullish, and I stand by the calls mentioned in the caption here: There's a great future ahead for the white metal in 1H 2021 and beyond.
Ratios and Miners
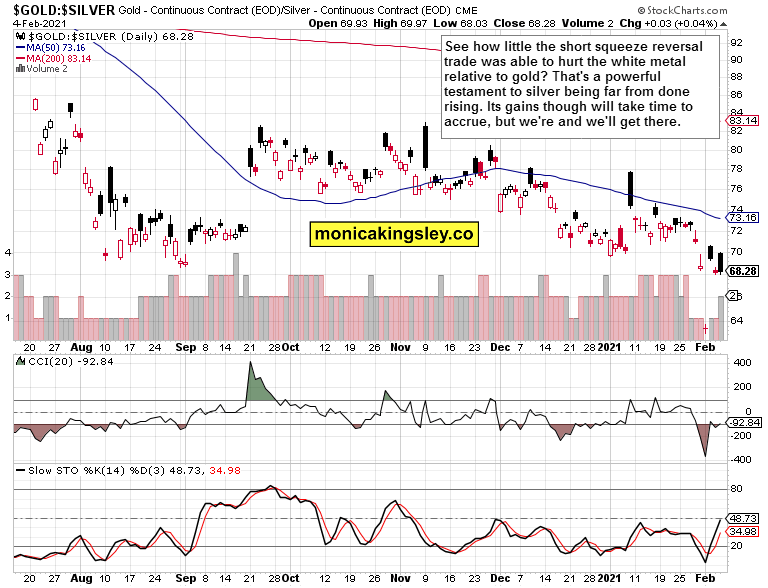
The gold to silver ratio also continues favoring the white metal, which retreated this week (post-Monday). It didn‘t affect the downward trending values in the least.
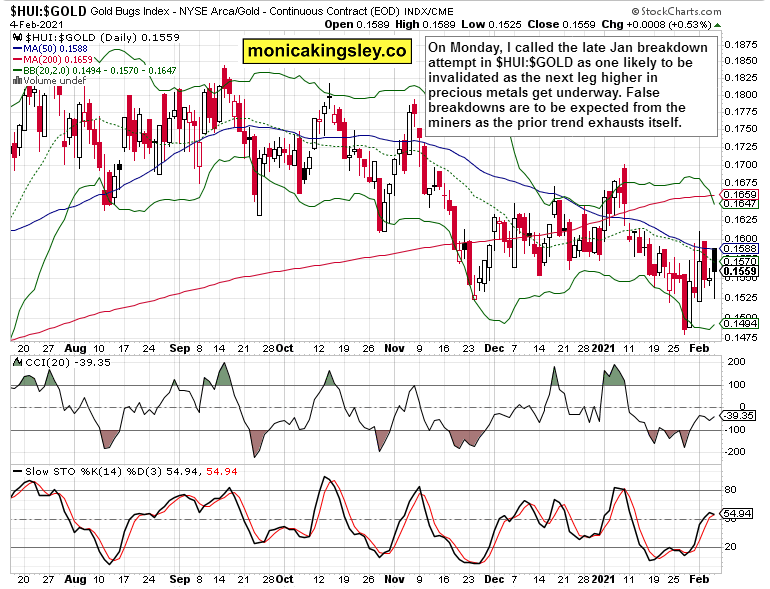
The miners-to-gold ratio continues supporting my call of breakdown invalidation leading to a new precious metals upleg. I made the calls along these lines both on Tuesday and prior Monday, when I featured my 2021 prognotications on stocks, gold, the dollar and Bitcoin.
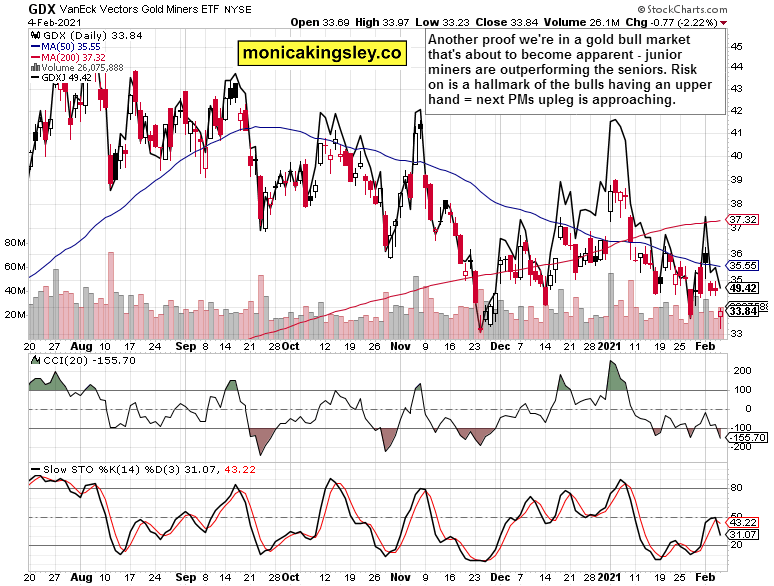
Senior gold miners (VanEck Vectors Gold Miners ETF (NYSE:GDX)) are taking a back seat to juniors (VanEck Vectors Junior Gold Miners ETF (NYSE:GDXJ)), and that‘s a hallmark of bullish spirits returning – first below the surface, then very apparently. While we have to wait for the latter, its preconditions are here.
Summary
It‘s time for the gold and silver bulls to reappear after yesterday‘s outsized setback. Crucially, it hasn‘t flipped the short- and medium-term outlook bearish as the factors powering the precious metals bull run are in place.
