Do you consider how inaccurate the monthly economic releases are? Every day, the markets react to the deviation from expectations for releases on employment, manufacturing, spending et al. No consideration is made to the backward revisions which effect HOW one should view the current data.
Follow up:
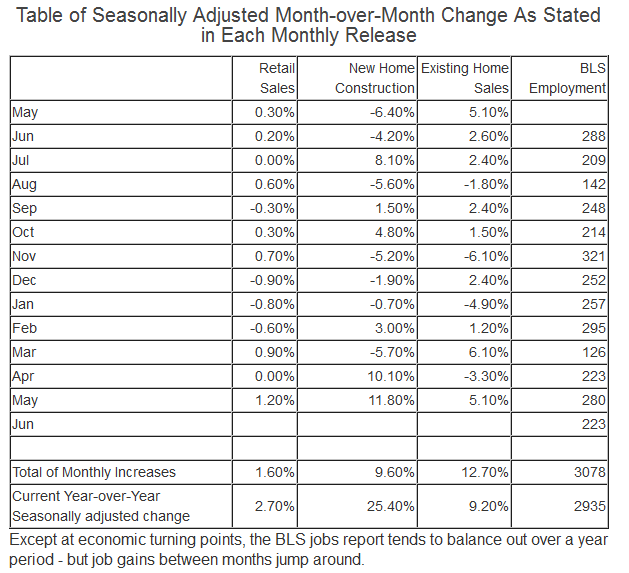
Analysis of monthly movements are hardly ever correct as backward revisions, sometimes even a year or more afterwards, continue to change how one should have viewed the data. To understand the problems with writing correct analysis based on each monthly release can be understood by looking at 12-month totals of the monthly gains or losses (as stated in each month's release) versus the currently stated annual change.
Table of Seasonally Adjusted Month-over-Month Change As Stated in Each Monthly Release
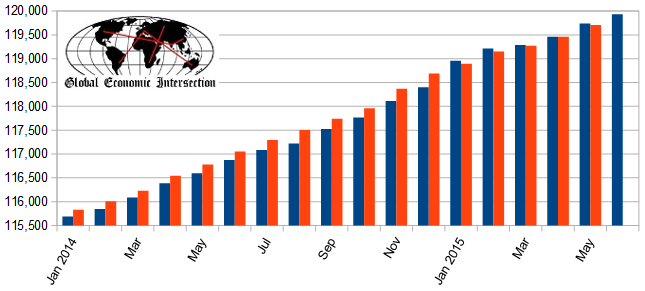
Change in Seasonally Adjusted Non-Farm Payrolls Between Originally Reported (blue bars) and Current Estimates (red bars)
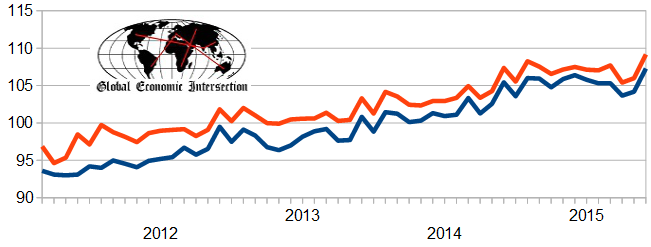
And even the Fed's Industrial Production Index (which I consider the most accurate in real time), is subject to monthly revision for 6 months following the first issue of data - and then there is annual benchmarking (which was just completed this week):
Total Industrial Production - Unadjusted - Original Headline Index Value (blue line) and Current Index Value (red line)
In my analysis of the various releases - I try to emphasize three month rolling averages which tend to remove much of the distortions caused by accuracy issues in the initial monthly releases. Thus at times, this approach puts my analysis at odds with the headlines - both from a positive and negative standpoint.
Overall, most of the monthly releases are too inaccurate in real time to put much weight on the headlines.
Other Economic News this Week:
The Econintersect Economic Index for July 2015 strengthened partially reversing last month's decline. Still, the tracked sectors of the economy remain relatively soft with most expanding at the lower end of the range seen since the end of the Great Recession. Thinking through the reasons for this month's increase, it was the improvement in a few areas from terrible to marginal growth.
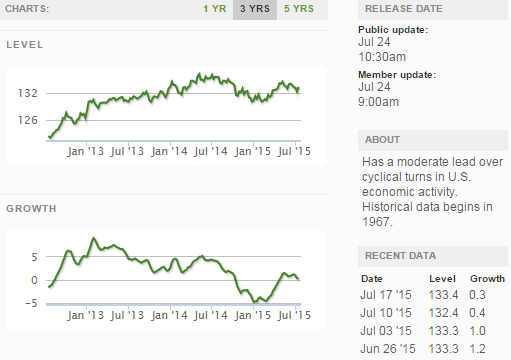
The ECRI WLI growth index is now in positive territory but still indicates the economy will have little growth 6 months from today.
Current ECRI WLI Growth Index
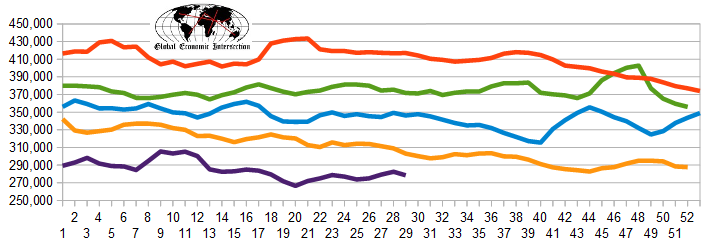
The market was expecting the weekly initial unemployment claims at 275,000 to 300,000 (consensus 279,000) vs the 255,000 reported. The more important (because of the volatility in the weekly reported claims and seasonality errors in adjusting the data) 4 week moving average moved from 282,500 (reported last week as 282,500) to 278,500. The rolling averages generally have been equal to or under 300,000 since August 2014.
Weekly Initial Unemployment Claims - 4 Week Average - Seasonally Adjusted - 2011 (red line), 2012 (green line), 2013 (blue line), 2014 (orange line), 2015 (violet line)
Bankruptcies this Week: Privately-held Great Atlantic & Pacific Tea (aka A&P), AmeriResource Technologies, Corporate Resource Services
Click here to view the scorecard table below with active hyperlinks
Weekly Economic Release Scorecard:
