Just today, Tether vulnerability was announced, sending Bitcoin down to its lows. How are Bitcoin and the Monero altcoin doing in this context? Learn here.In this post, I applied the following tools: fundamental analysis, candlestick patterns, all-round market view, market balance level, oscillators, trading volume
Dear friends,
Today, I’d like to analyze Monero to Bitcoin. It has been a month already since my last forecast for XMRBTC; it’s time to sum up the results and update trading scenario for the pair.
But first, let’s find out what is going on in the market.
It’s all about a little-known Chinese company SlowMist that audits blockchain security. According to the company’s Twitter, created two months ago, and the website, registered only in January, 2018, this project is a young startup, which seeks some cheap fame by announcing Tether double-spend.
This news was widely spread by the cryptocurrency media and news channels, without finding out the real situation.
The news is released under headlines like “Tether platform features a serious vulnerability.”
I am surprised at how easily people give in to panic and start dancing to manipulators’ tune, spreading out the fake information without a sufficient analysis.
In the end, manipulators stocked up at lows and again got use of hamsters.
It seems that, being afraid of people’s anger, these so-called "analysts" tried to calm everybody down, saying that it is not about Tether blockchain, it is rather about an exchange that doesn’t wait until the transfer is validated and deposits the money; moreover, they don’t even name the exchange ...so, congratulation on another great FUD!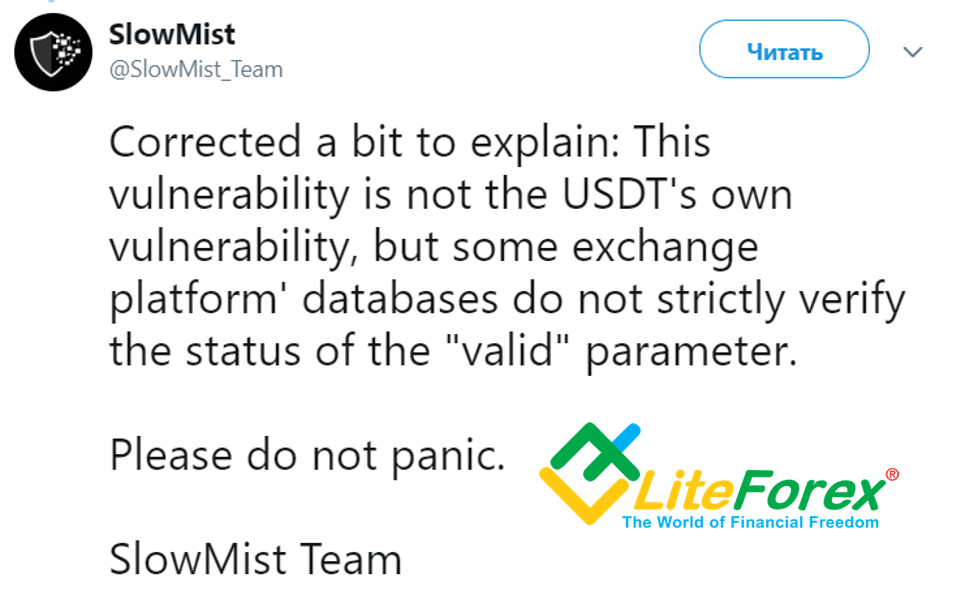
By the way, about manipulators buyouts. They are clear in the minutes timeframes (marked the bars with circles in the chart below).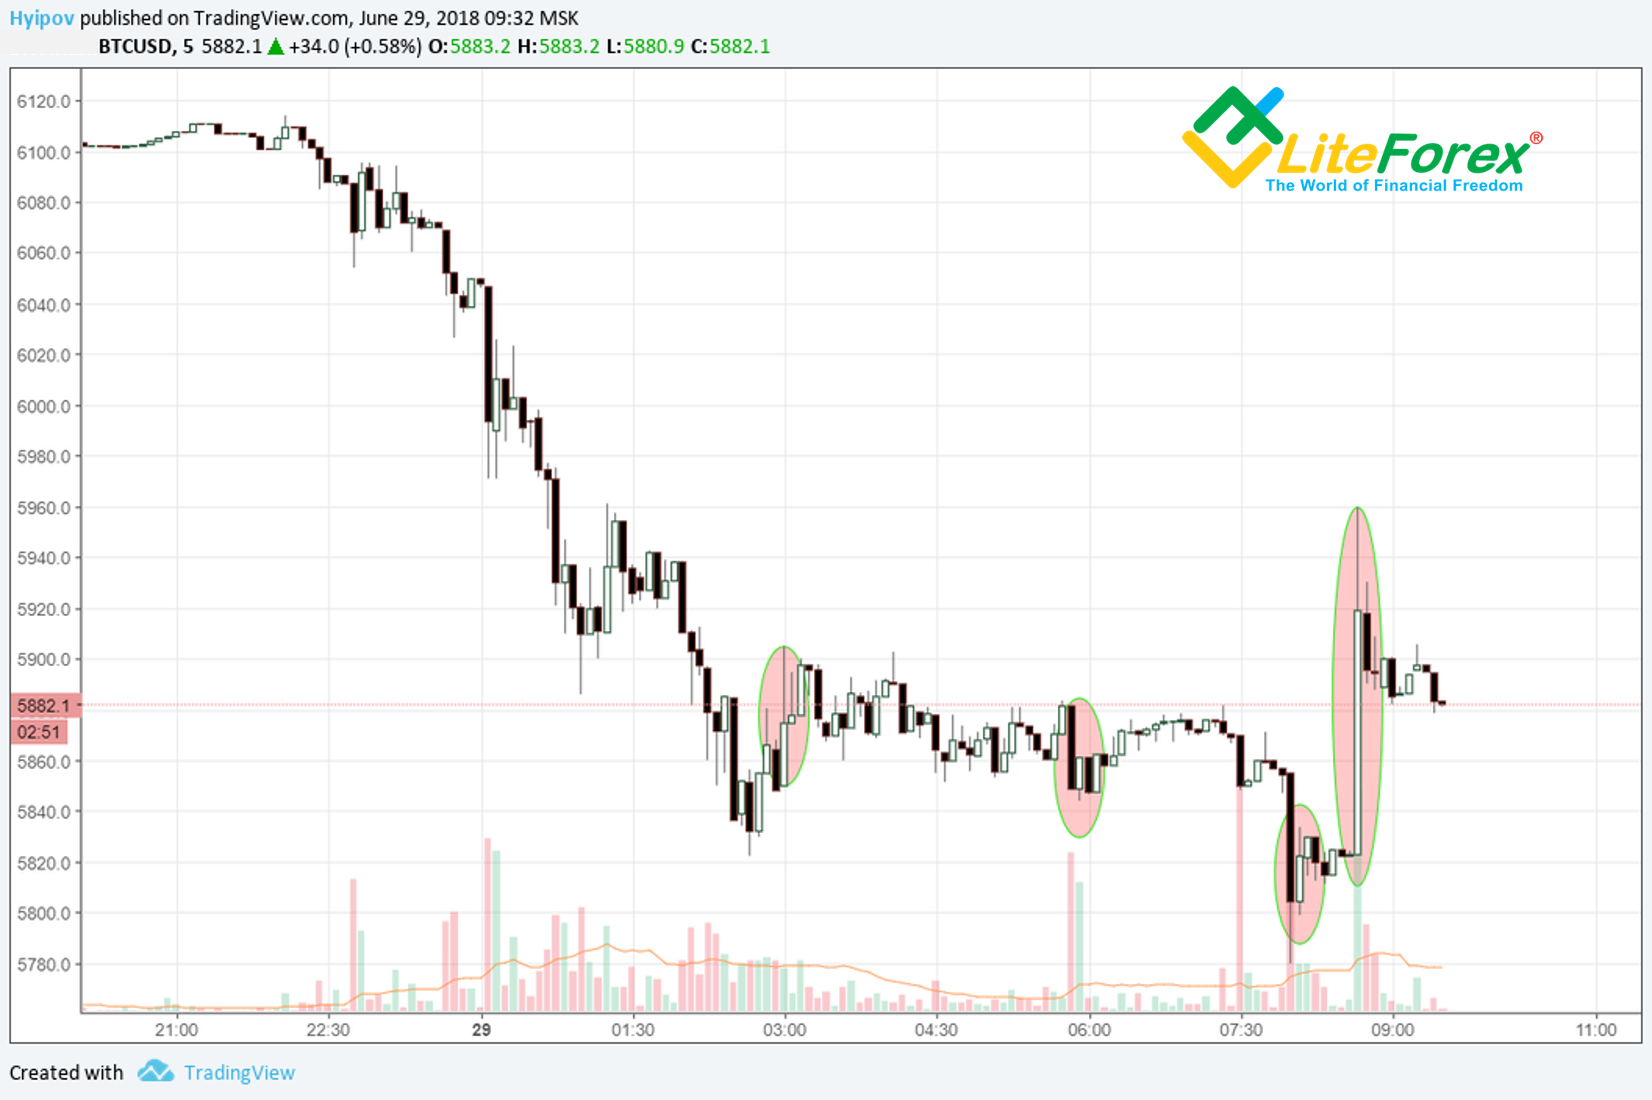
The conclusion is that you shouldn’t panic, rather, you should read the news carefully and learn to get use of it. And I ask those, who are spreading unverified information, to learn their lessons and be more professional.
If we go back to Monero, there is hardly any news related to it. Its trend has recently been following the general market sentiment, moving within the range, suggested by the previous forecast.
A month ago, I told that Monero was weak, steadily moving towards the support at 0.01979 BTC around January’s low (see the chart below):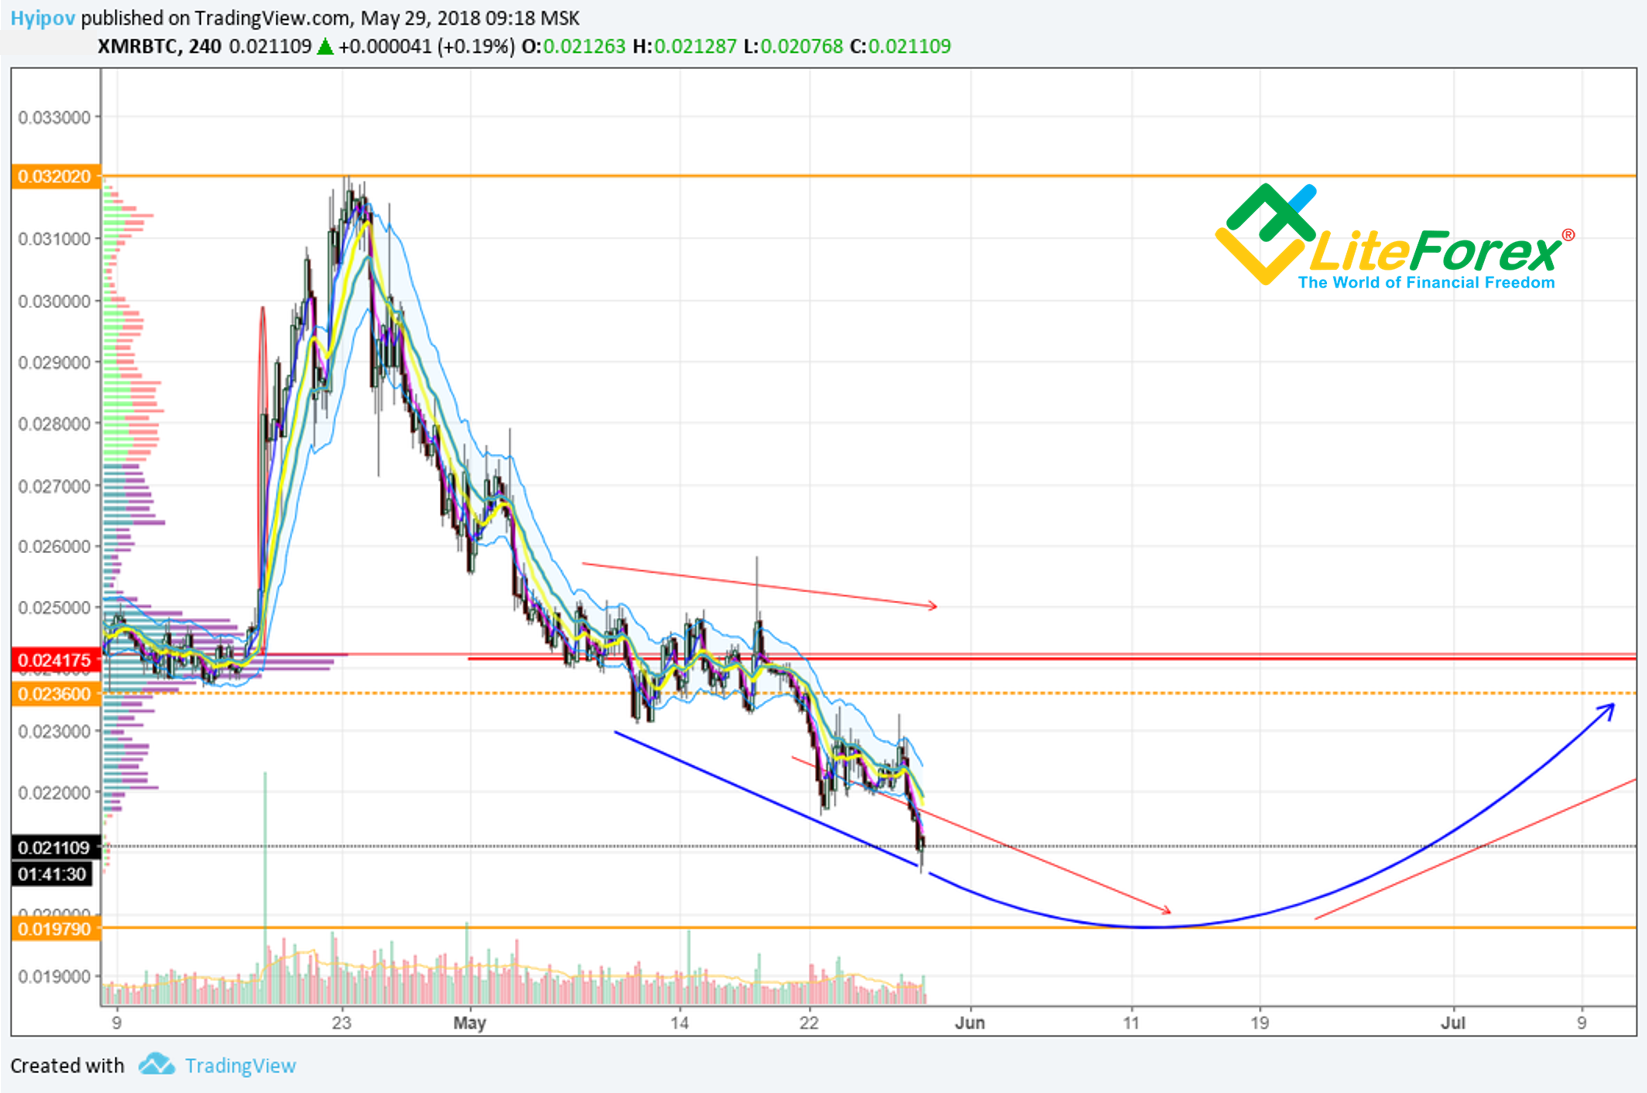
Finally, the actual current data are as follows (see the chart below):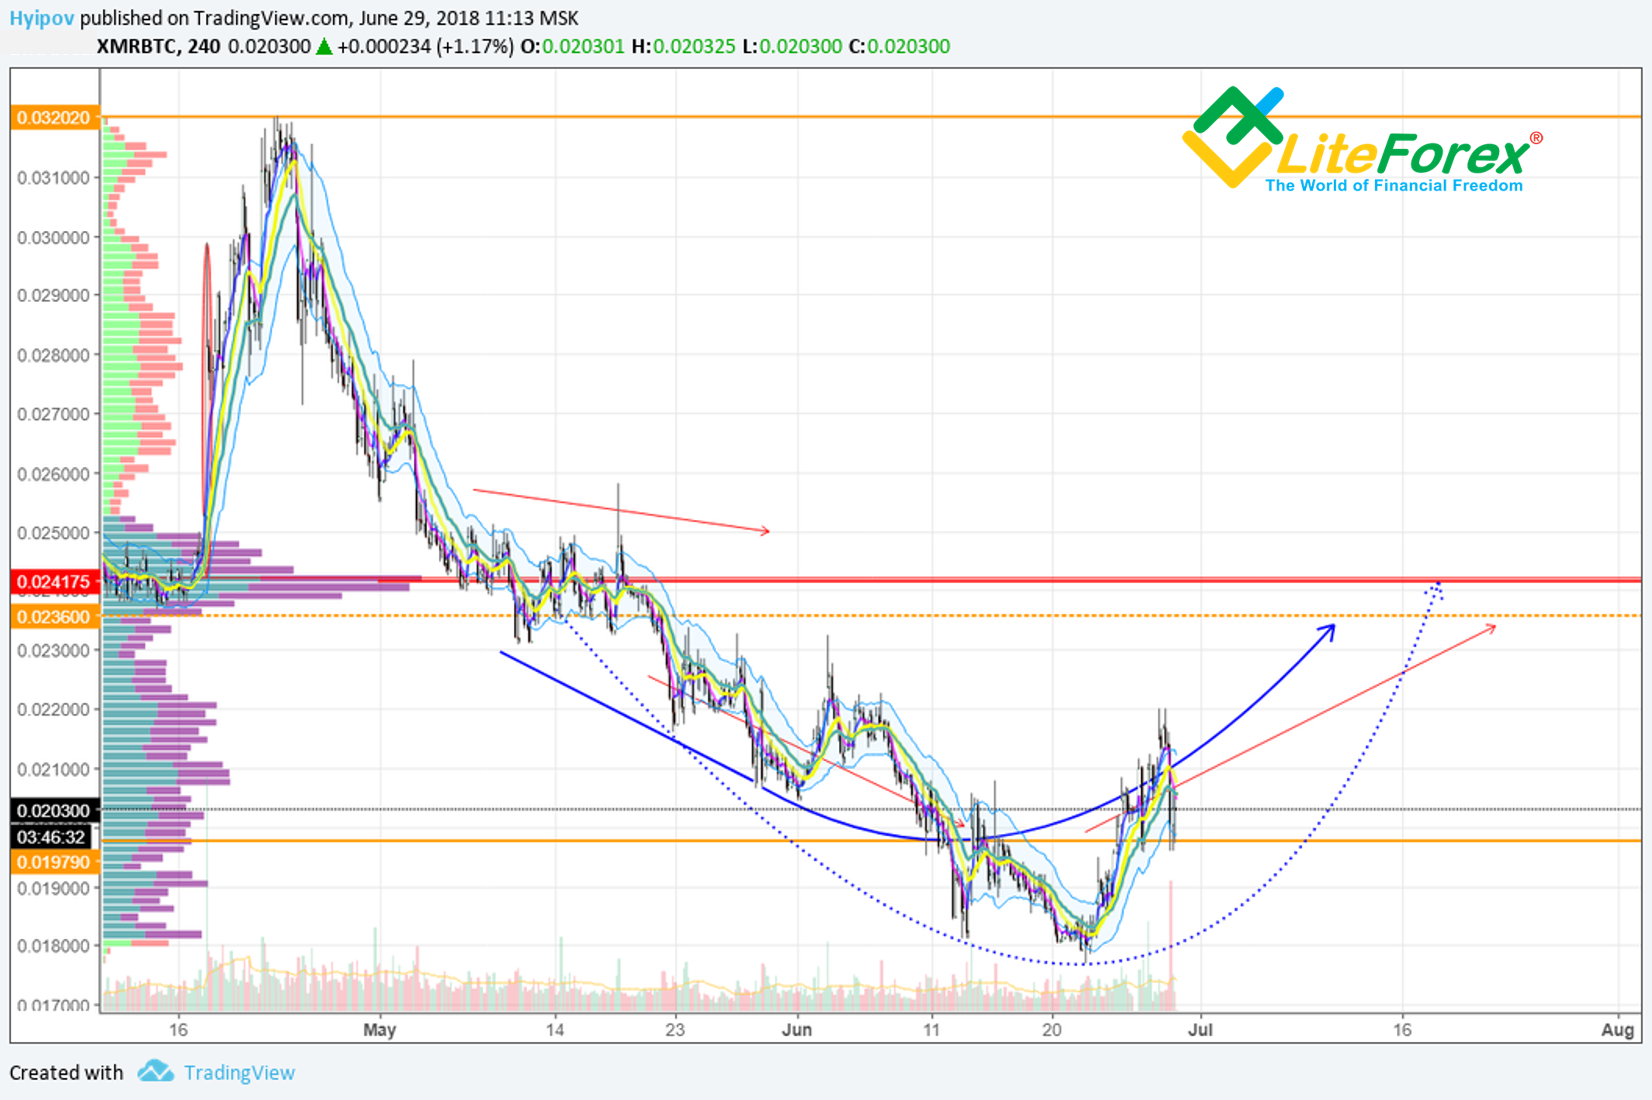
As you see from the chart, the ticker reached the target at 0.01979, didn’t hit 0.016 and started reversing.
We’ll find out if the price will reach the origin of the bearish wave at 0.024175, after analyzing all-round market view.
But, first, lets’ compare Monero to the private currencies index.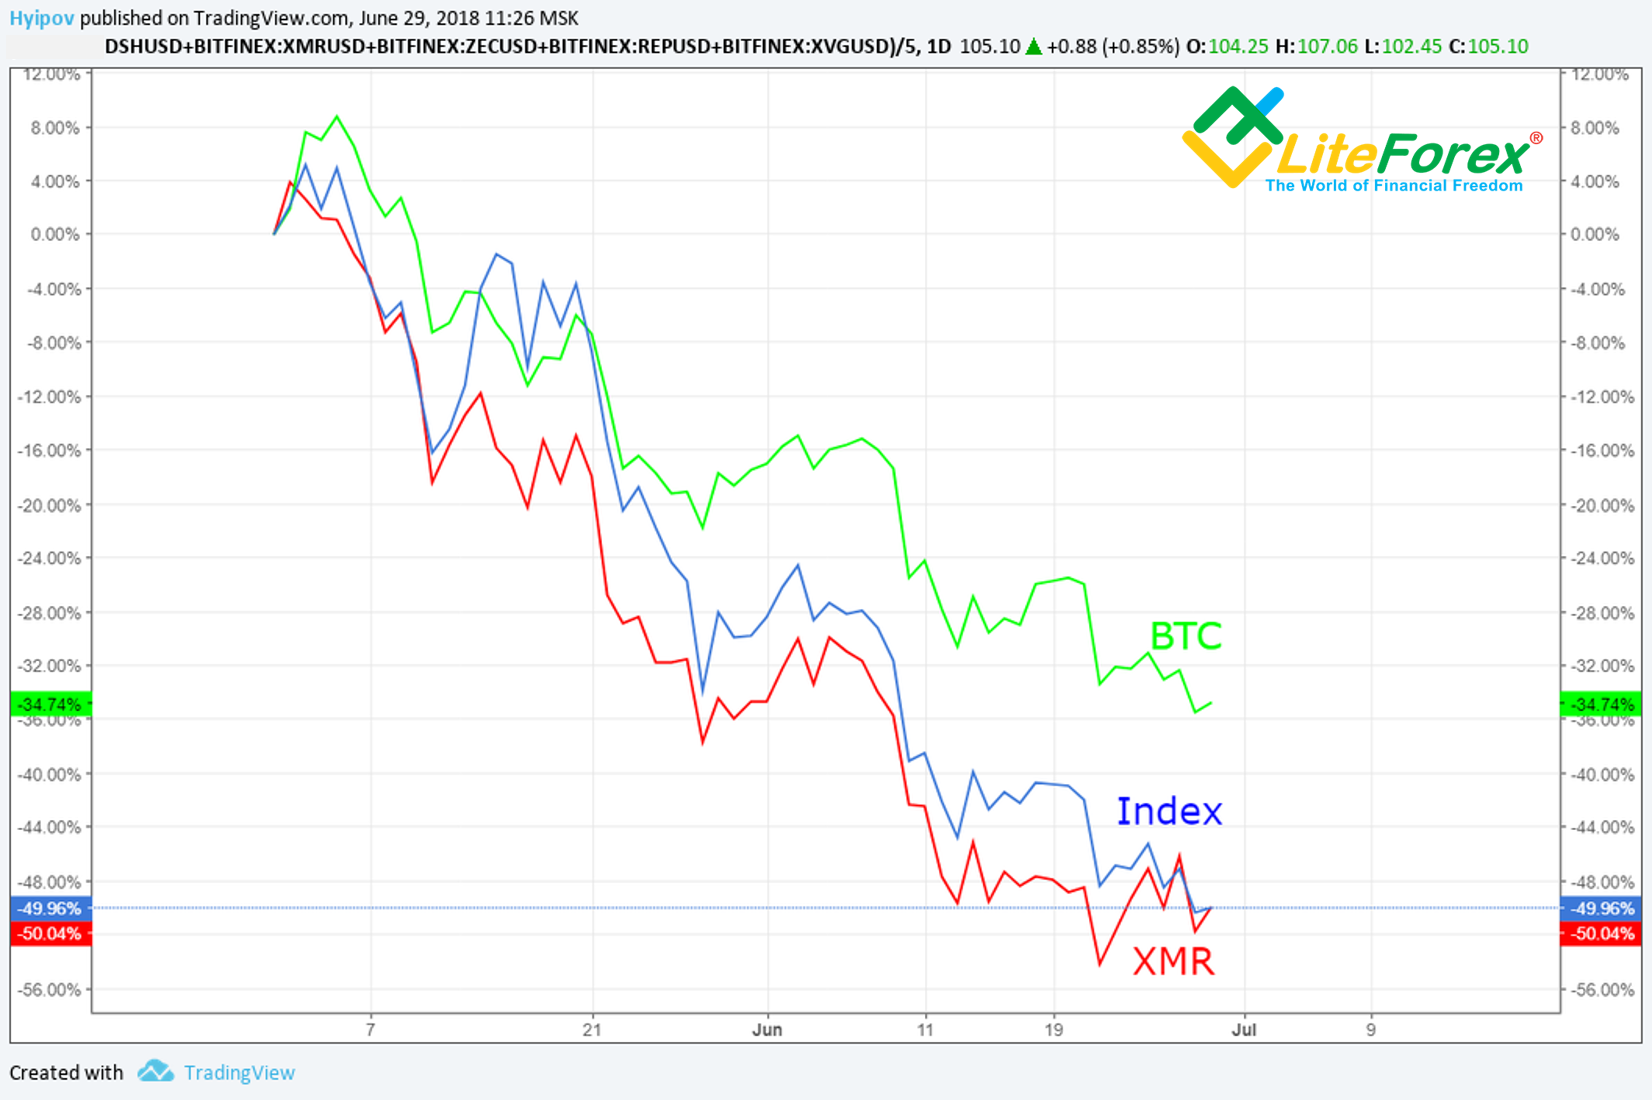
As you see in the chart above, XMR is closely following the composite index that includes DASH, Monero, Zcash, Augur and Verge, but it is doing worse than BTC.
First of all, this fact proves the weakness of confidential currencies in the market and high risks, associated with them; on the other hand, for Monero, it indicates that it has neither its own growth drivers nor fundamental factors to emerge from general mainstream.
Now, let’s go on with XMR/BTC all-round analysis: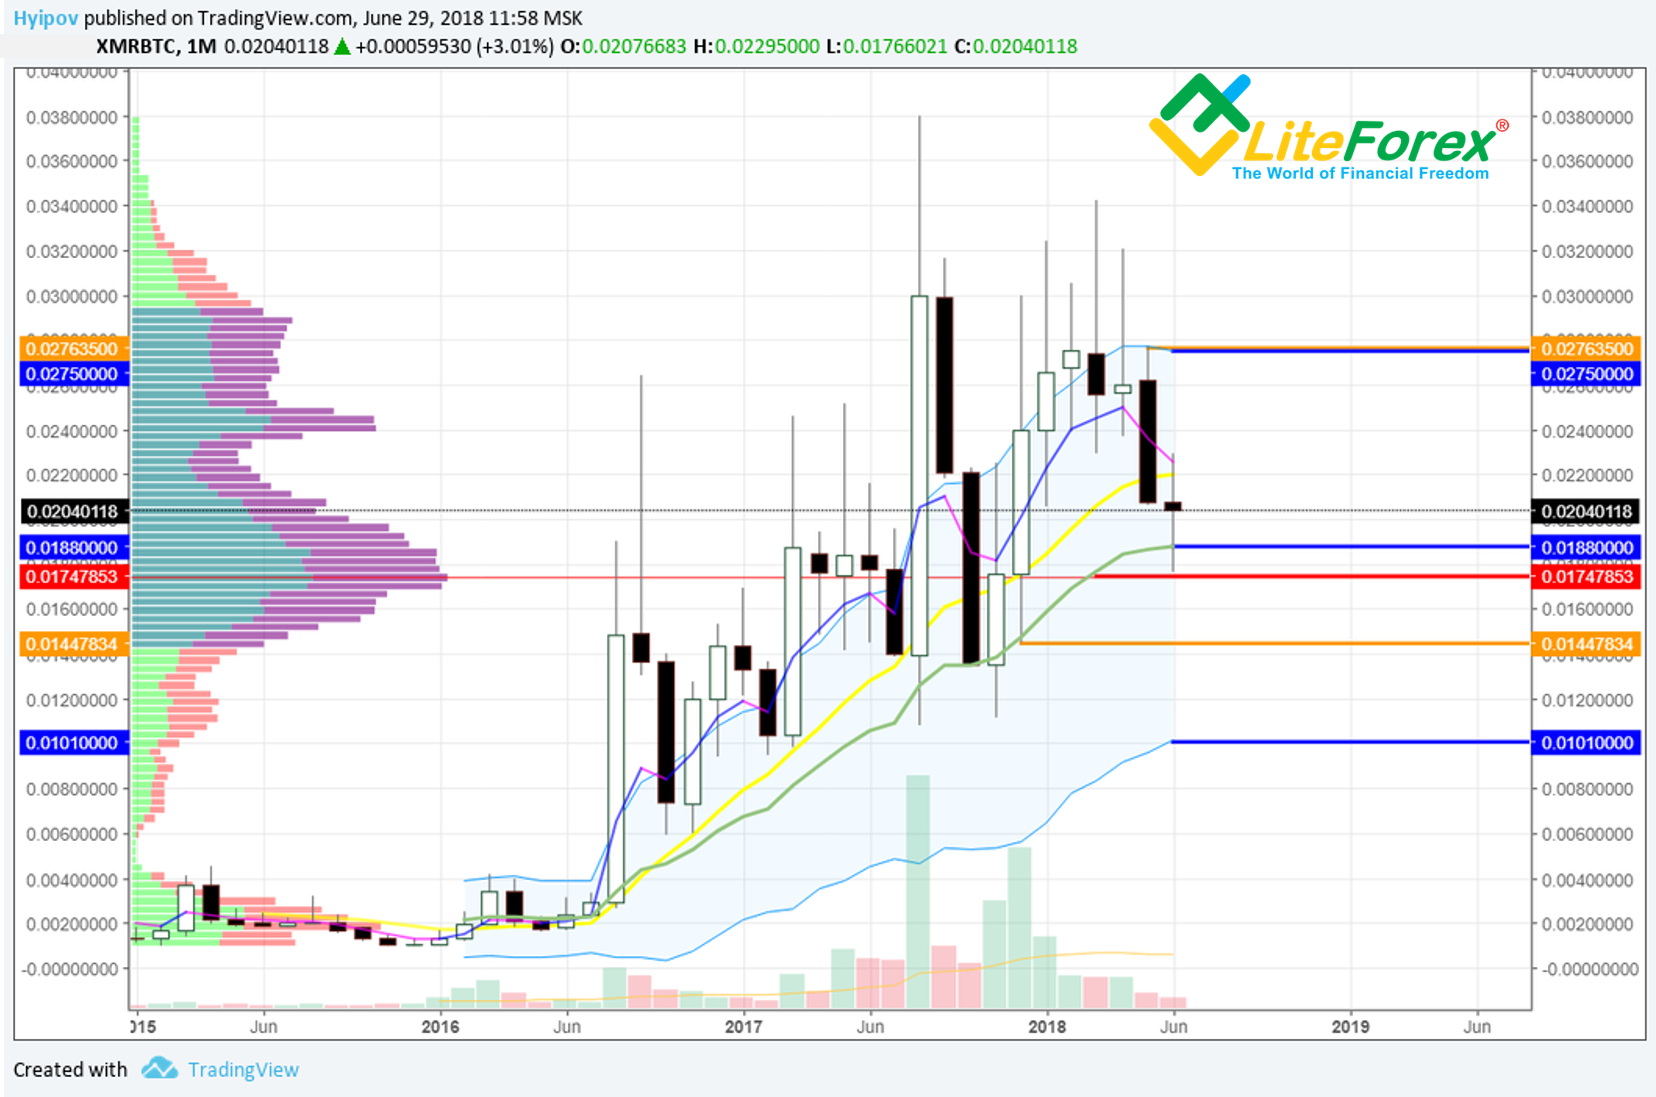
You see in the XMRBTC monthly timeframe the next low, which is to be reached; it is 0.01447 BTC, it is also the low of December, 2017 (orange line).
On the way to this level, I also marked the balance moving average of Keltner channel at 0.0188 (marked with the blue line), and the point of control of the volume profile at 0.01747 (marked with the red line).
As you see in the chart above, Keltner channel’s moving average supported XMR/BTC ticker during the whole year of 2017. It is still a relevant support, according to trading in June.
As the ticker is above is the point of control, it can well go up. Bridges haven’t been burnt yet!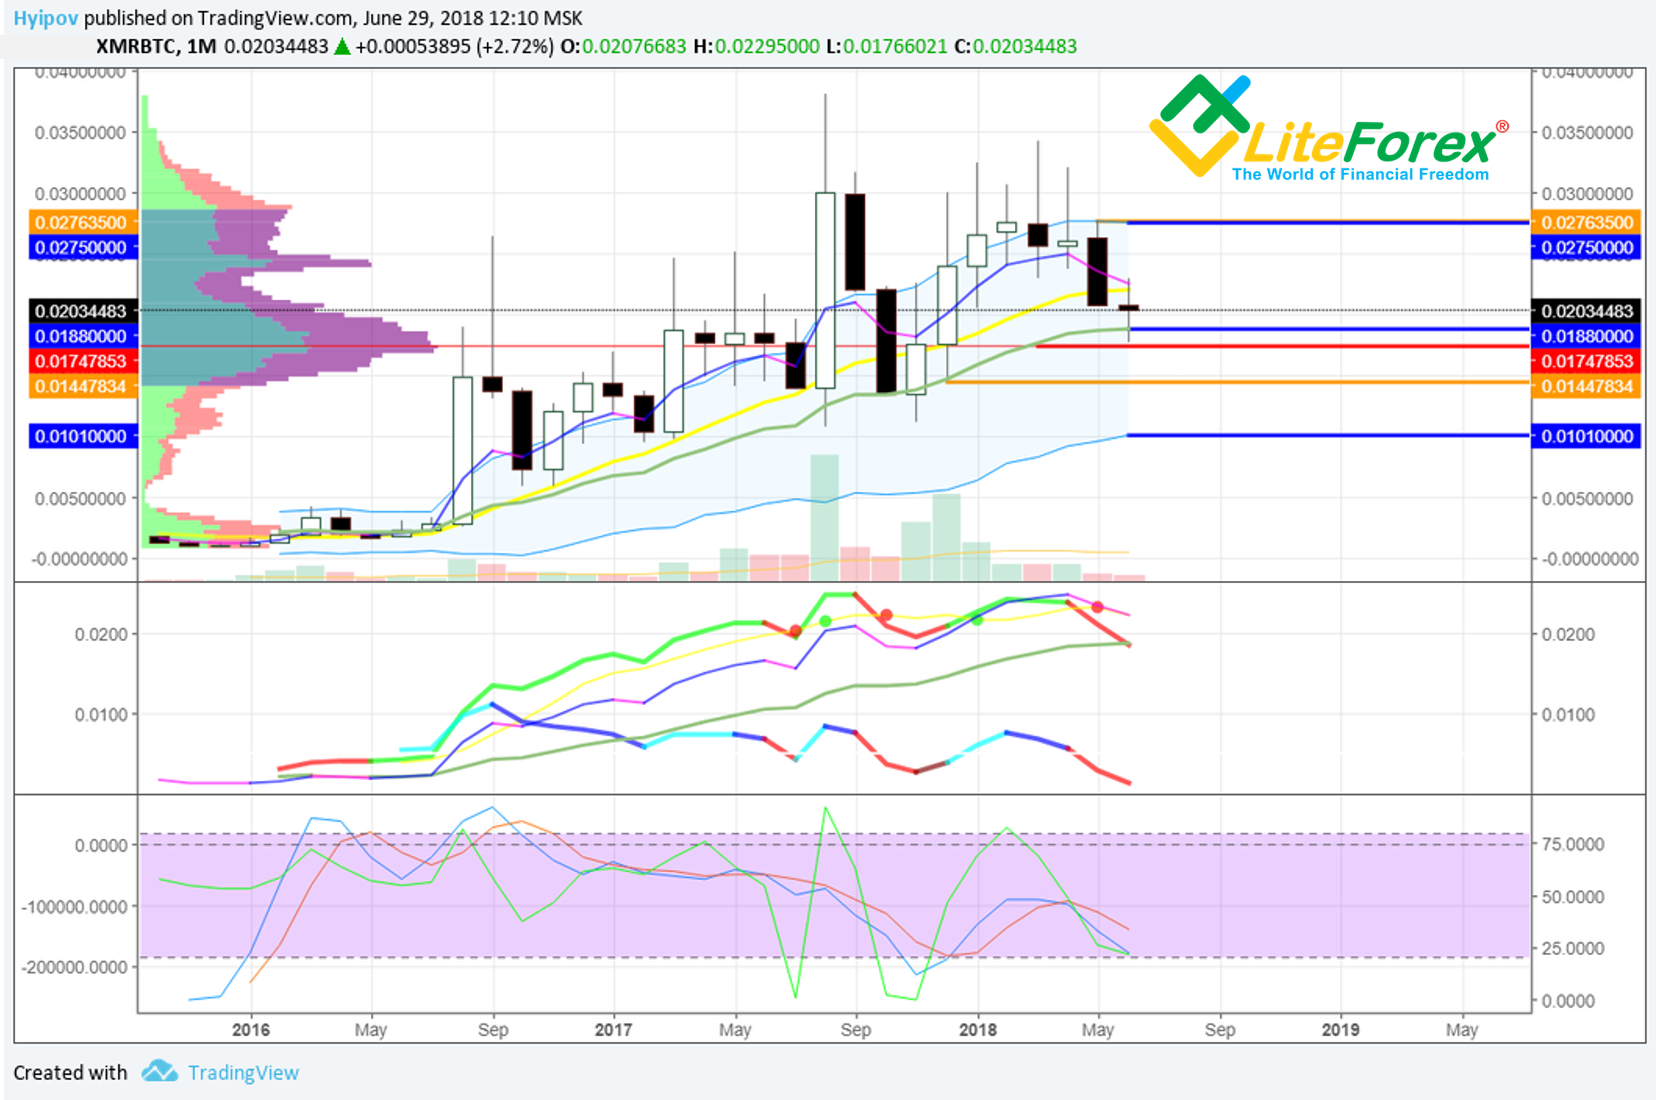
Nevertheless, according to oscillators MACD and RSI stochastic, the ticker is in the bearish trend and can possibly dive deeper.
If nothing changes fundamentally, the current June candlestick looks like doji; which suggests the market uncertainty and a potential possibility of reversal.
Bullish correction and the up-move continuing will be confirmed if the current monthly highs at around 0.02295 BTC are broken through.
To find out the chances for it, let’s study the shorter timeframes.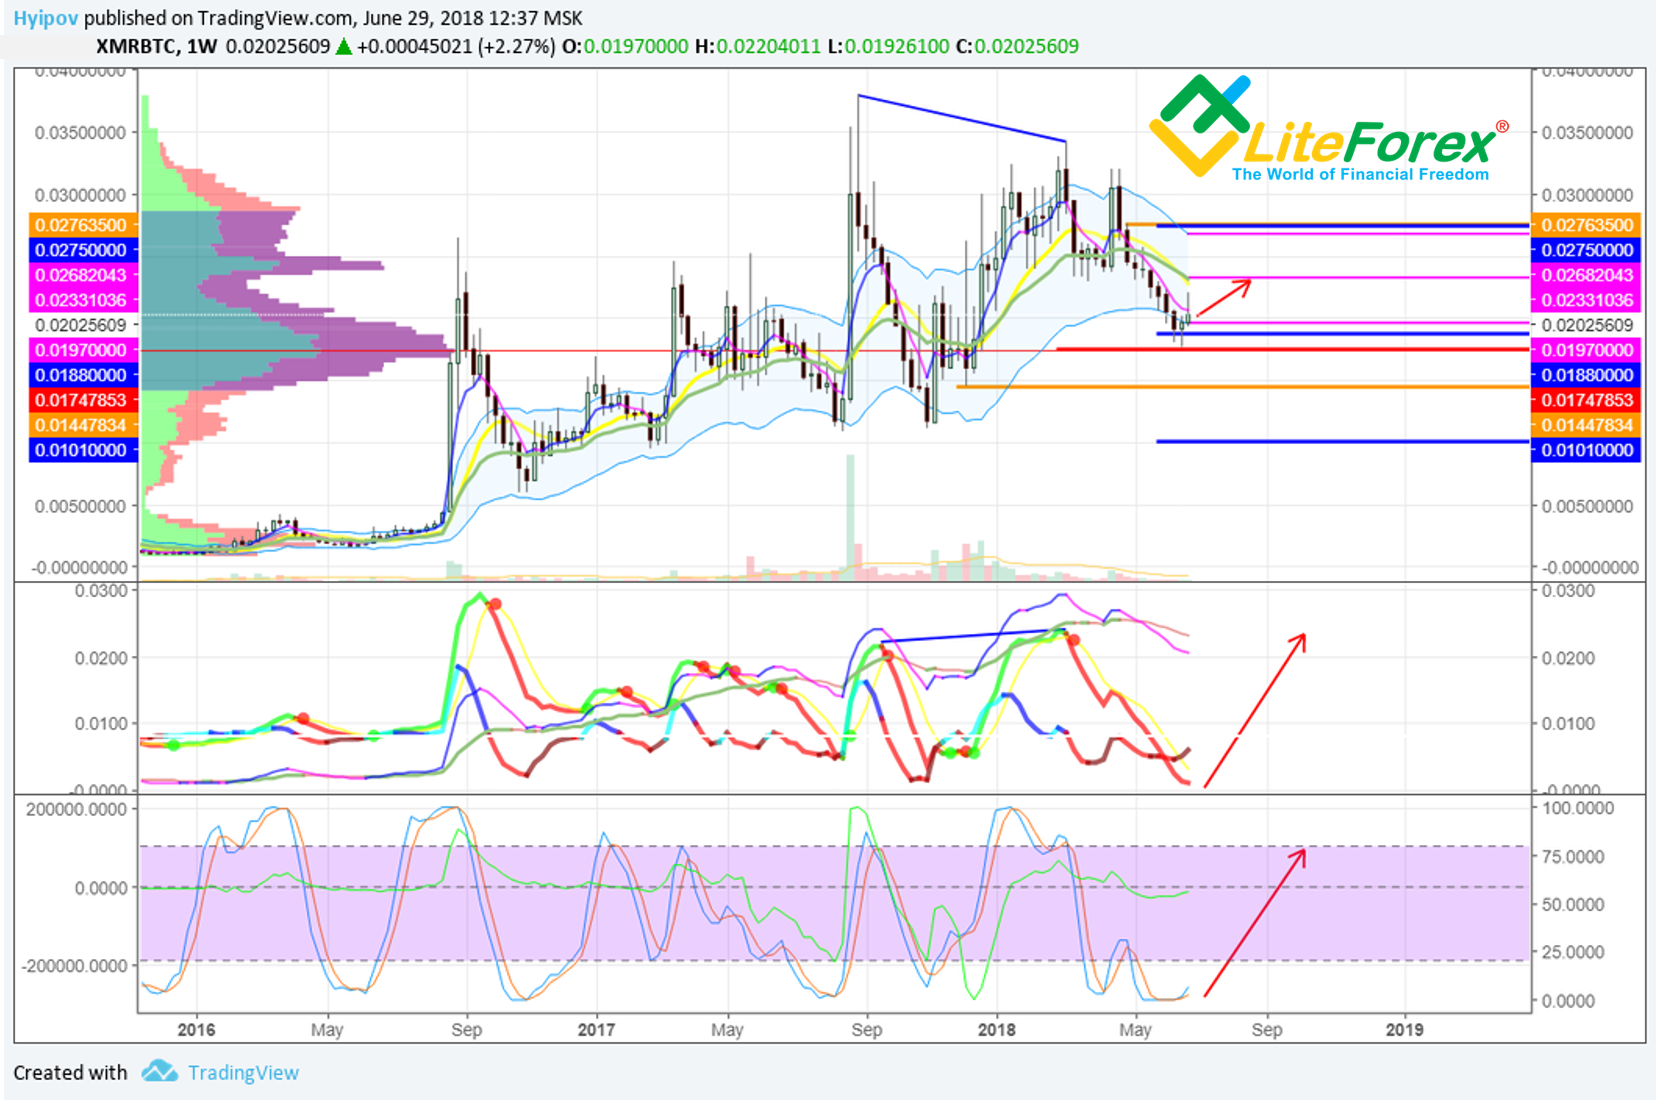
In the weekly XMR/BTC chart, there is the price rebound from the bottom border of the weekly Keltner channel (marked with purple).
Oscillators MACD and RSI stochastic are in the oversold zone, which indirectly suggests a bullish correction in the short term.
According to the last candle's tail, the market has tried to test Keltner channel’s balance moving average at 0.02682. If the bullish sentiment develops, it will be the first buy target.
In general, the weekly chart is moderate positive, suggesting a possibility of the bullish correction.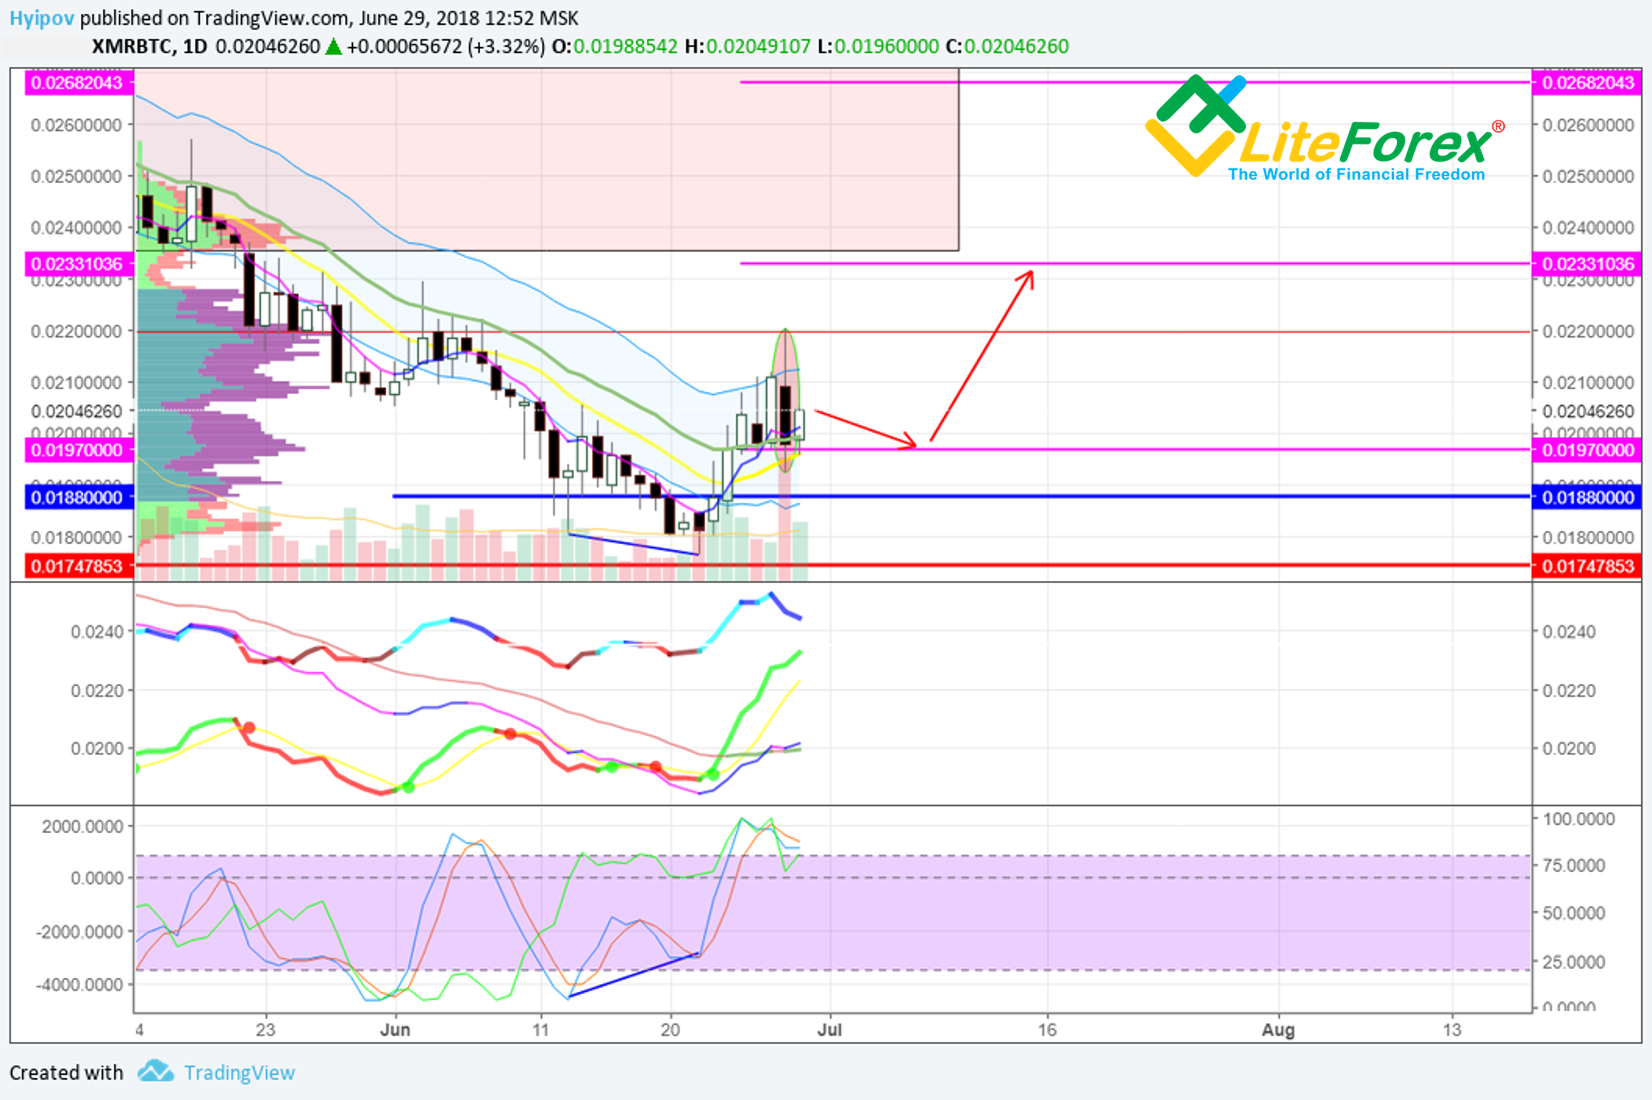
In the daily timeframe, the first prominent thing is the stochastic RSI bullish convergence with the price. We saw this signal work out. As yesterday there appeared black candle, similar to engulfing candlestick, the rise stopped; now, we can’t expect anything more than a sideways trend, at best.
To correct the price lower, it needs to break through the support level at 0.0197 BTC; I don’t think bears can do that.
Yesterday, we all witnessed how sellers tried to reverse the market, dumping quite a lot; the market, however, was held and didn’t go below the key level.
Summary: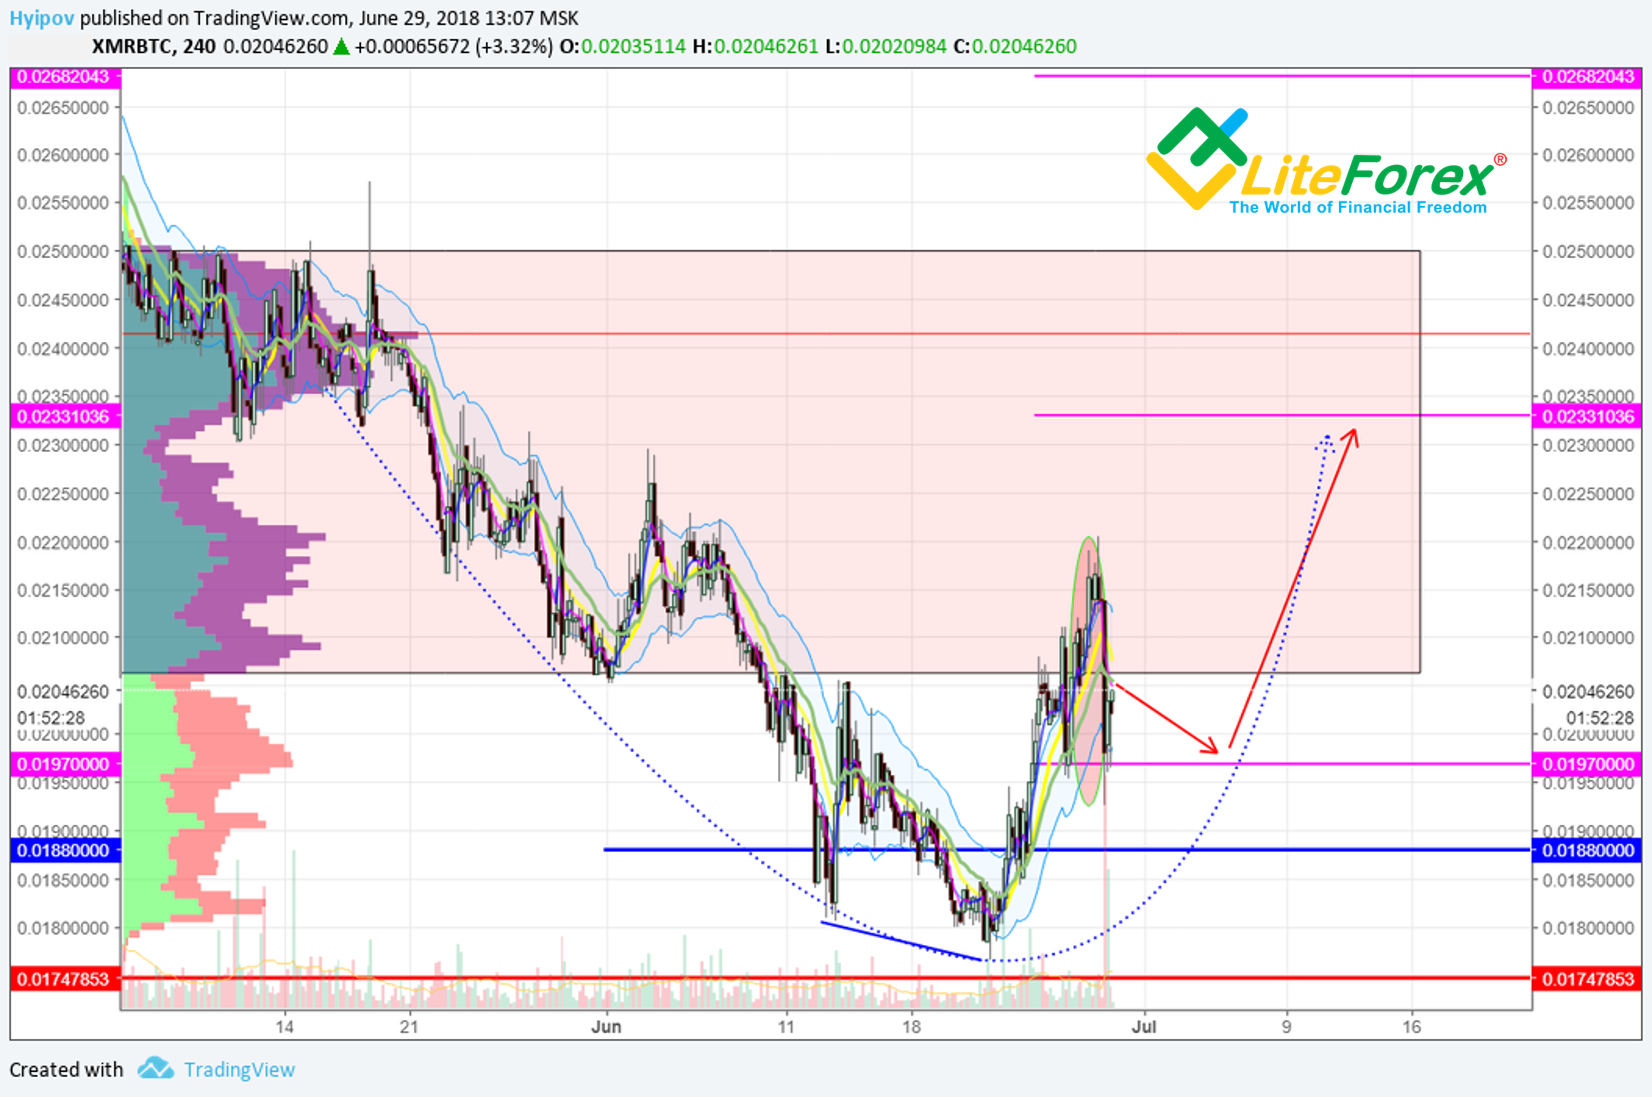
Monero performs worse than the cryptocurrency market, but follows the general trend of other private altcoins. Currently, it is in the strong oversold zone even in relation to Bitcoin. I think the most likely scenario is that level 0.0197 BTC will be held through the sideways trend.
If the level is held, the ticker can enter the trading channel at 0.020- 0.025, with the first target at 0.0233 BTC.
Support levels for the next two weeks:
- 0.0197 – highly likely to be reached by the price;
- 0.0188 – can be reached;
- 0.0174 –could hardly be reached;
- it is unlikely go below 0.0174.
Resistance levels for the next two weeks:
- 0.0220 – highly likely to be reached by the price;
- 0.0233 – can be reached;
- 0.0268 – could hardly be reached;
- it is unlikely go above 0.0268.
