When will the trend start? What are the main targets in June? In this post, I applied the following tools: candlestick analysis, all-round market view, market balance level, oscillators, trading volume.
As bitcoin is rising, I decided to update my forecast for litecoin today. Traditionally, I’ll start with analyzing fundamental factors, affecting the cryptocurrencies, and litecoin, in particular. I must say, having spent quite a lot of time, I failed to find anything that would distinguish litcoin from its crytpo-siblings. Moreover, one of the recent important events, happened to litecoin is the news dated May 29 that LTC would be traded on Nasdaq future cryptocurrency exchange.
If you look at the LTC/USD price response, you’ll see that, although it strongly rebounded that day (marked with the blue arrow), trading volume is small, like the further growth. Finally, the most that the ticker was able to reach was 0.764 Fibo from the last bearish trend. Then, it rolled back rather quickly.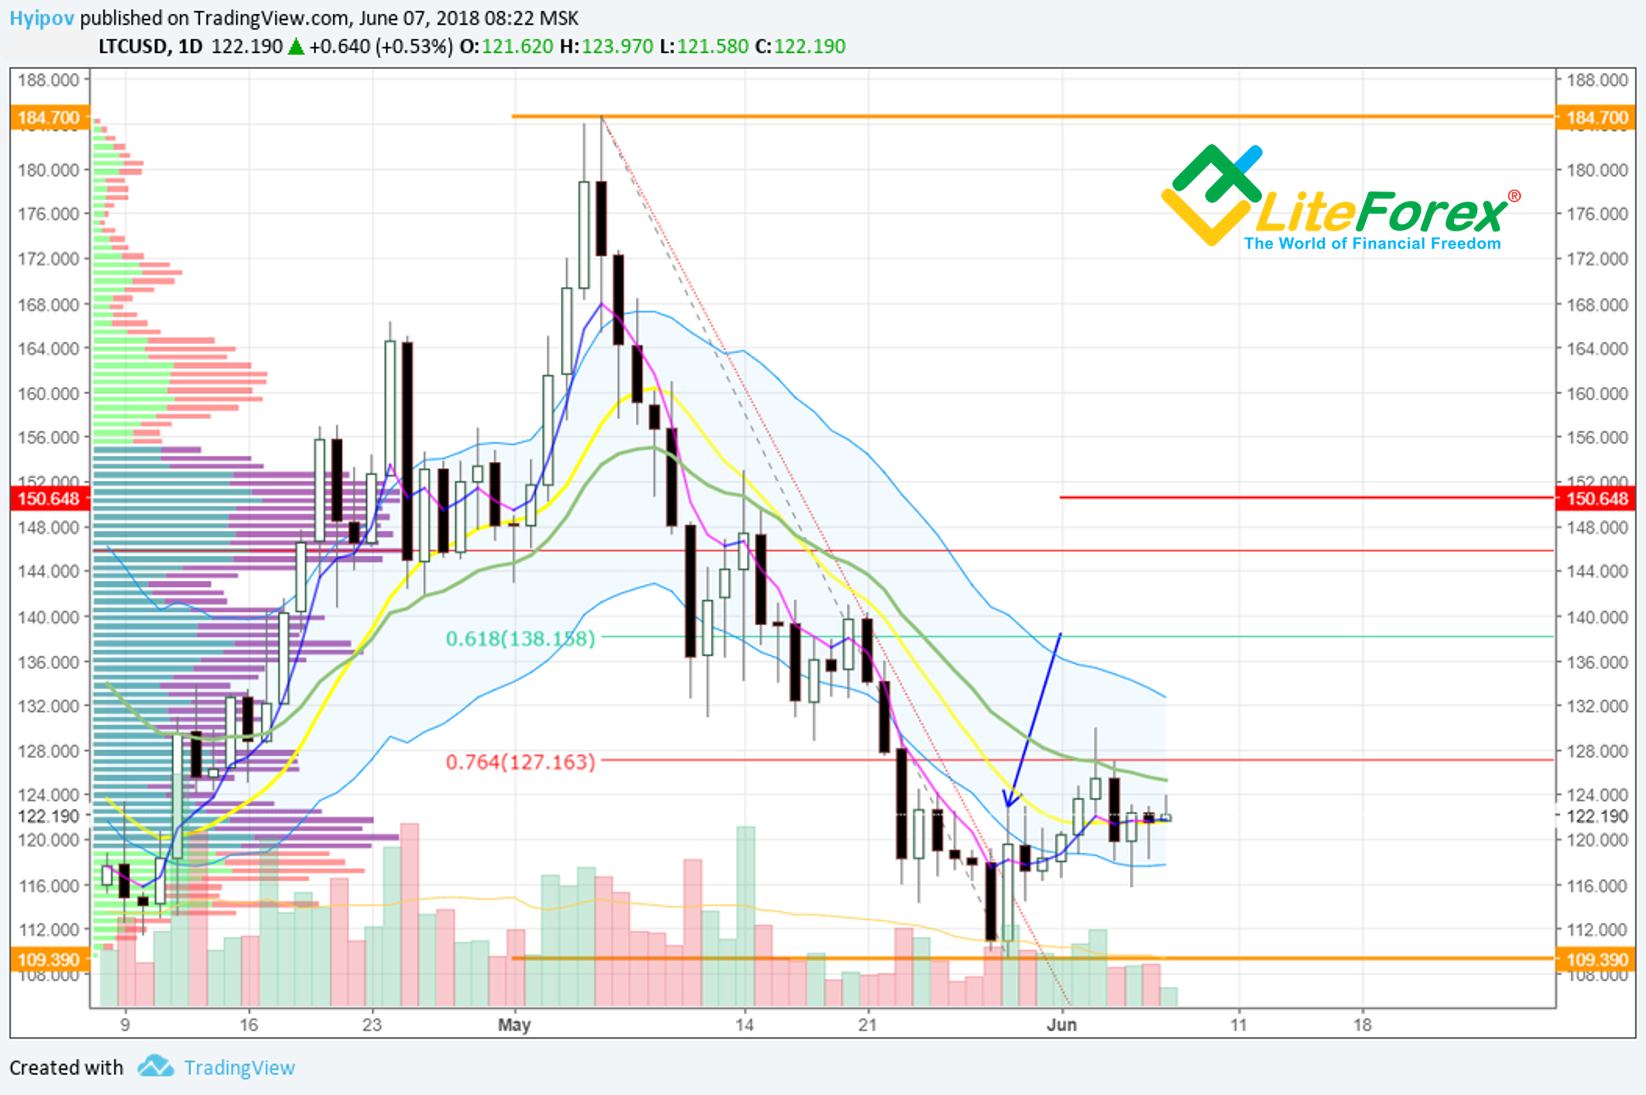
Another interesting tool of fundamental analysis is the activity on GitHub developers’ web site.
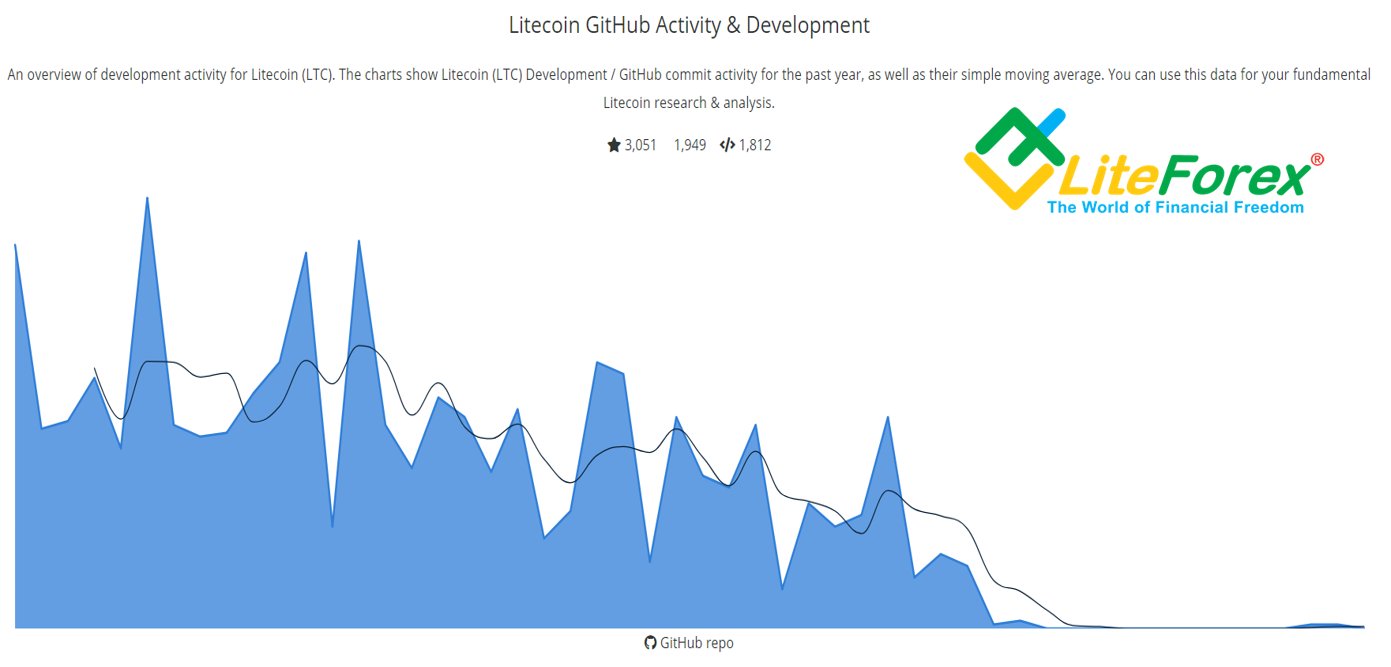
As it is clear from the chart, since March, the development activities have shrunk to almost nothing, which means there are no advancements in the coin’s development and improvement. This factor is very important, for it is the technological advantage over the rivals that is the key to surviving in future.
From the MBA course, I remember the Boston Consulting Group Growth-Share Matrix that estimates how much is a product needed and relevant. According to the current situation and the trend dynamics, litecoin has passed through the stage of fast growth and development, the “star” stage; now, it is a “cash cow”, when the product owners reap the benefits of their job without capital investing.
The owners’ objective at this stage is to make the cash cow’s lifespan as long as possible until it stops providing money and move on the next stage, “the dog”, that should be get rid of, according to business laws.
To get the cash cow live longer, the capital is transferred from investing in technological advancement into marketing and promotions. The only thing that doesn’t let litecoin die is its huge community, rich history and, as yet, quite modern and relevant technologies. But without capital investment, how long litecoin will remain the sixth largest coin by market cap?
To study the situation with technical analysis, let’s start with the monthly time frame.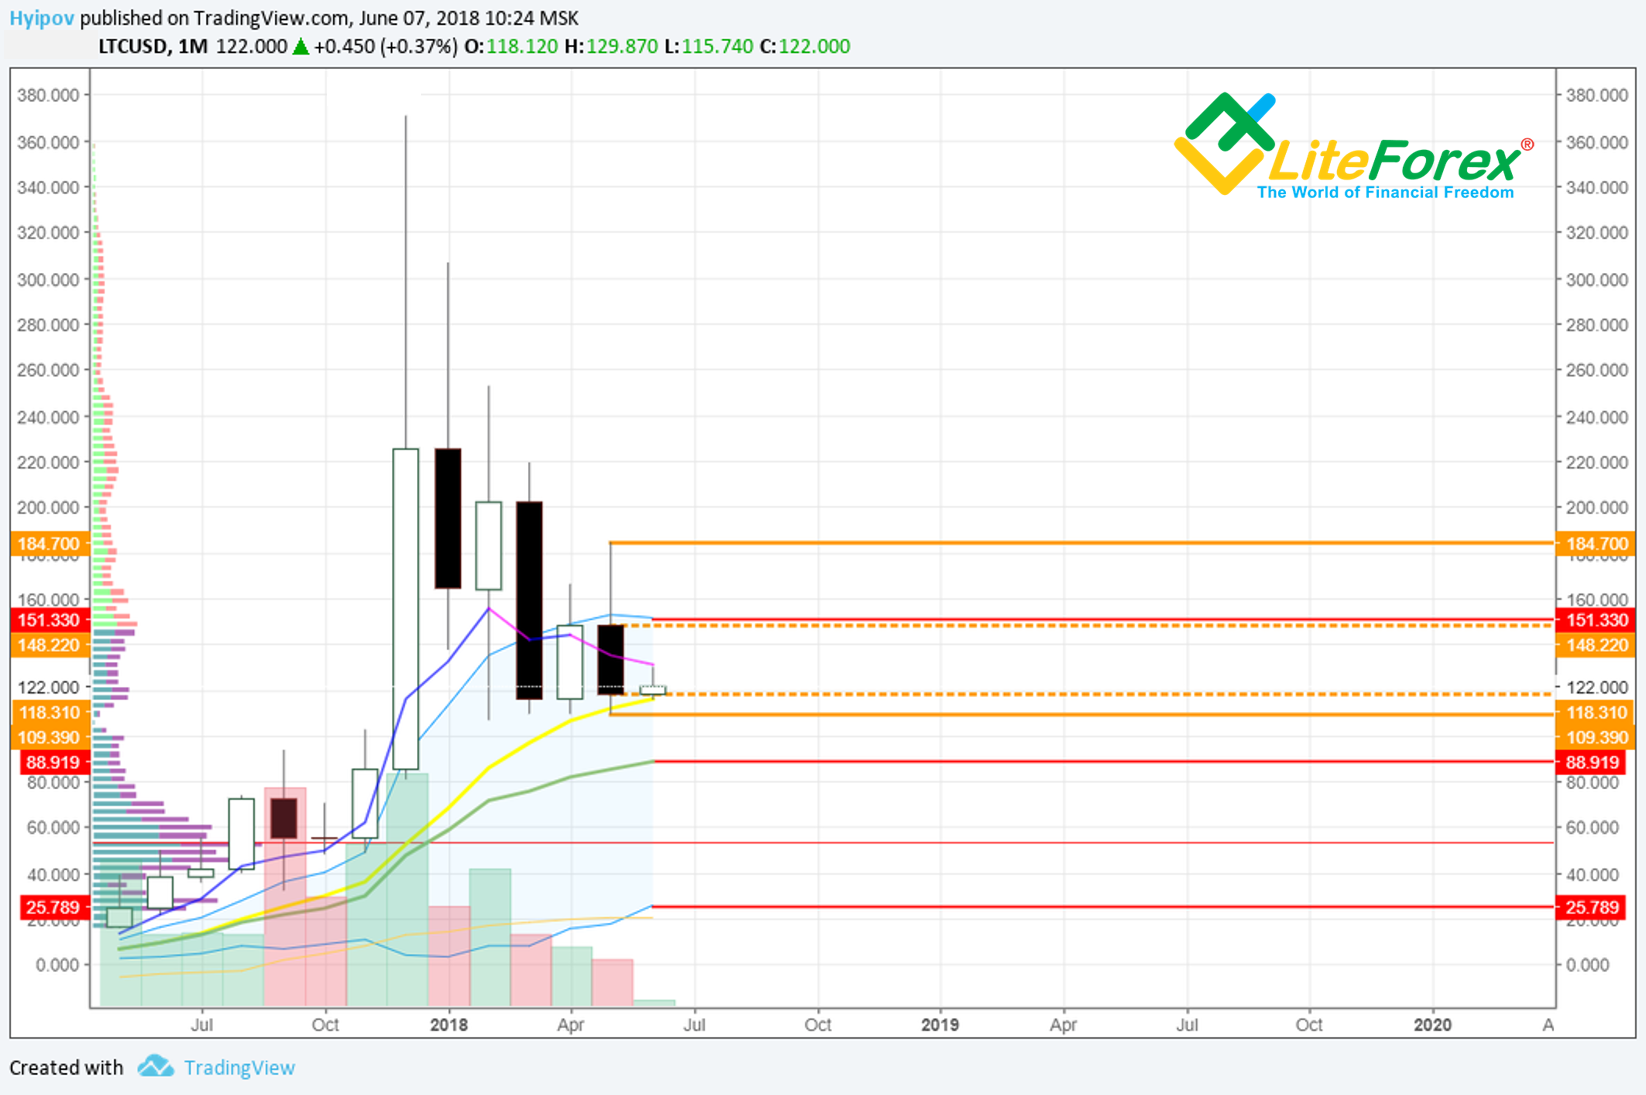
In the chart above, I marked May candle’s high and low with orange lines, open and close levels – with orange dots. These levels will support and resist the current market state, which should be taken into account in a more detailed forecast.
In addition to the above indicated key levels, I marked there Keltner channel borders with red lines. Here, the most important for us are the market balance level, the channel’s centre that is that 88 USD and the channel’s top border that is currently the strong resistance to the ticker’s advancement.
In the chart above, you see the ticker is near the previous month’s close and meets support from this level. On the other hand, we see the last monthly candle with long tails on the both sides, where the May candle’s high is higher than the previous one, and the lows are at the same level.
In general, it is a bearish pattern, rather than a neutral or a bullish one. It is clear from the strong tails’ asymmetry. The long tail at the top suggests bulls’ try to consolidate at the new lows, but powerful sellers quickly stopped buyers and drew the ticker down, back to the local lows..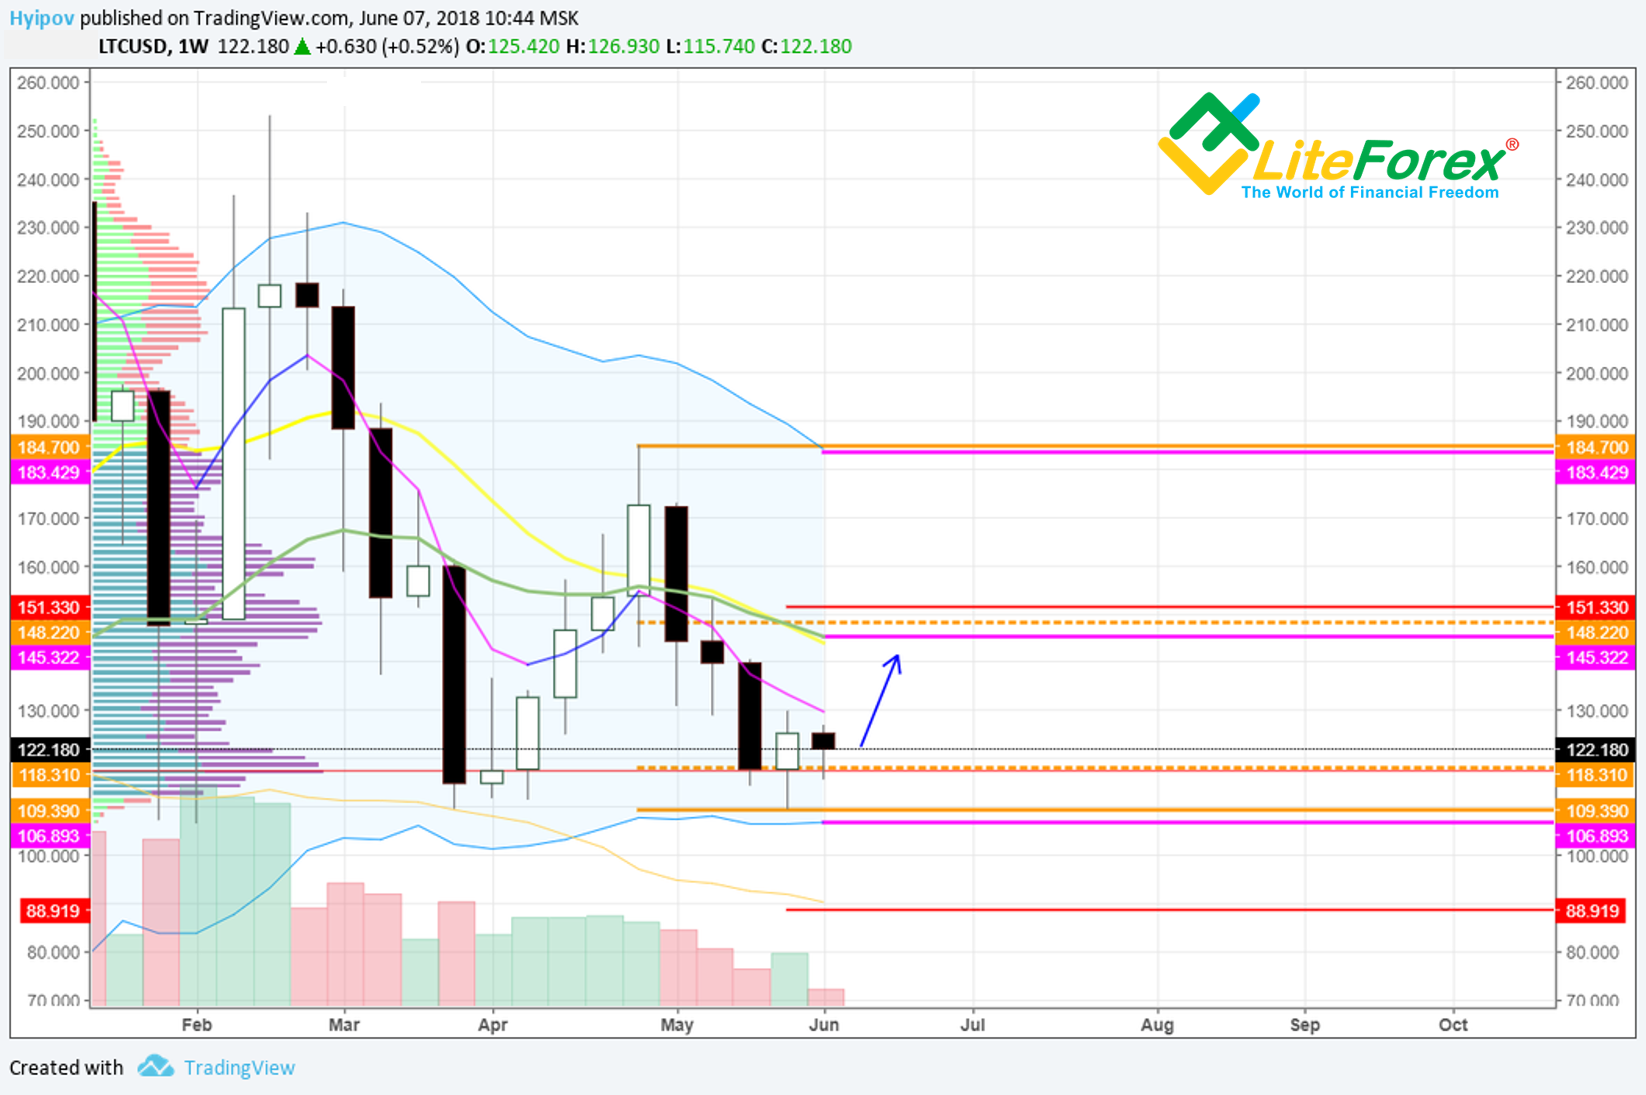
To complete the picture, let’s mark Keltner channel’s borders in the weekly time frame (marked with purple).
Finally we have the following:
- Last week closed in the form of short white candle, in the bottom half of the long black candle.
- This pattern is neutral and indicates the sideways trend.
Therefore, the close levels of this week will determine the trend direction.
In general, we see that the last candle’s tail touched the support level near Keltner channel’s lower border. At the same level, there is the trading range border and the checkpoint, according to the trading volume indicator.
This lot of supports encourages bulls to go up, and so, if manipulators don’t deliberately dump the market, the ticker will move towards the balance level, around 145 USD.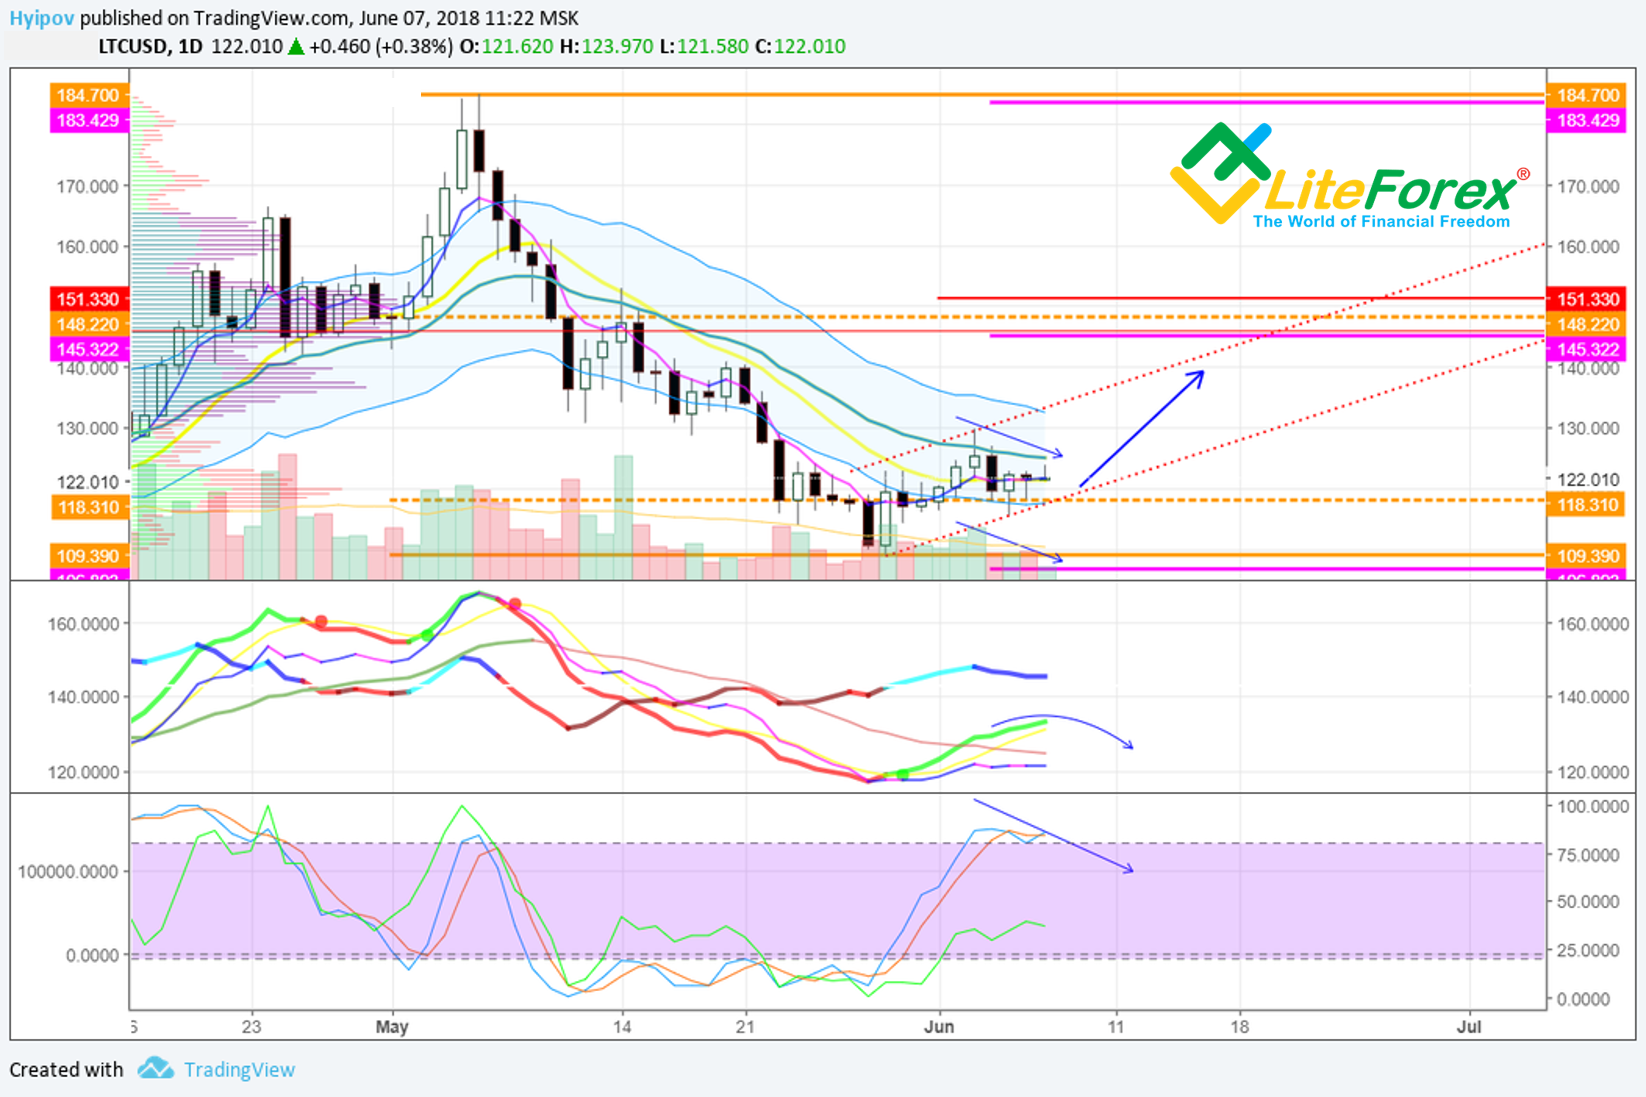
In the daily chart above, you see the ticker is stuck between Keltner channel and the monthly close level at about 188 USD.
Decline in trading volume, in general, suggests accumulation and a spring that is being pressed before the next momentum.
RSI stochastic indicates overbought at the current levels and a possible slight correction. MACD is in the green zone, moving up at a gentle slope, which most likely suggests it is neutral.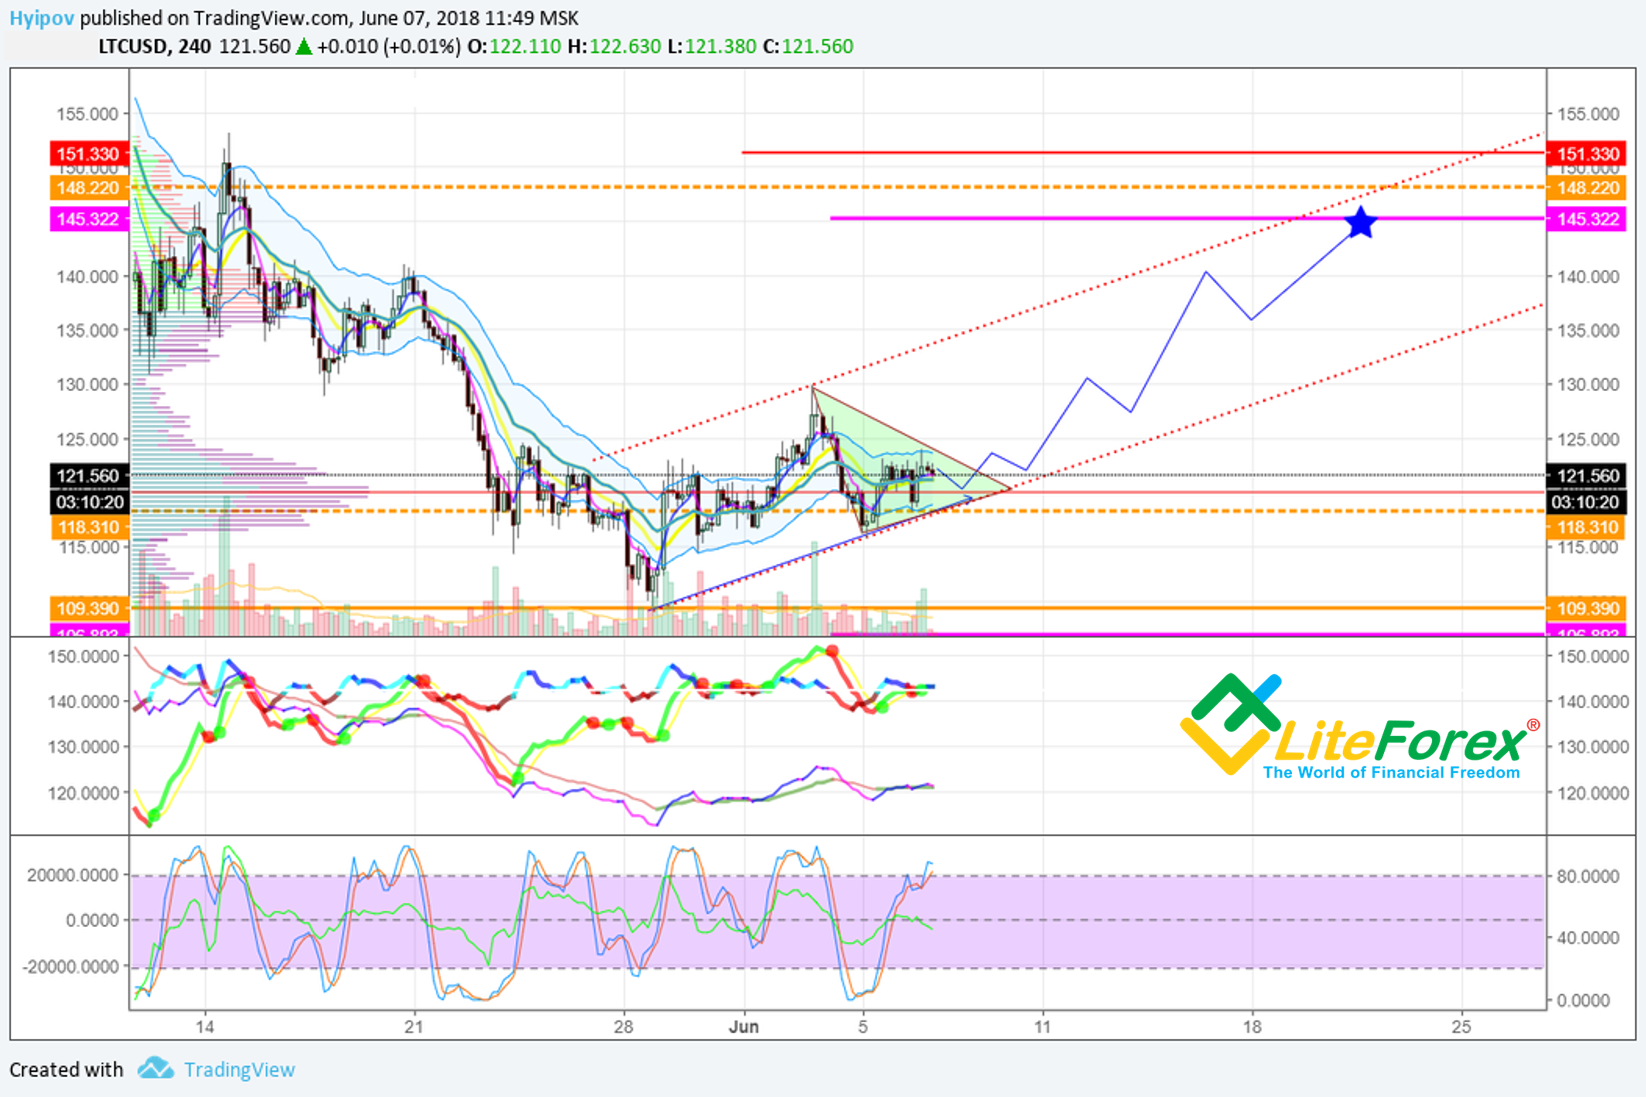
To add details to our scenario, let’s analyze 4-hour timeframe. In the chart above we see a spiral that is likely to be exited already tonight or tomorrow.
The ticker is most likely to move inside the ascending micro channel, get a momentum from the lower border and go up gradually.
The upward target is at 145 USD. The level is likely to be reached by the price within the next two weeks.
The pace of progressing towards the target greatly depends on the market sentiment. With the slowest pace, the ticker will reach the level in mid-June.
I don’t think the price will drop lower than 109 USD during the next two weeks.
I wish you good luck and good profits!
