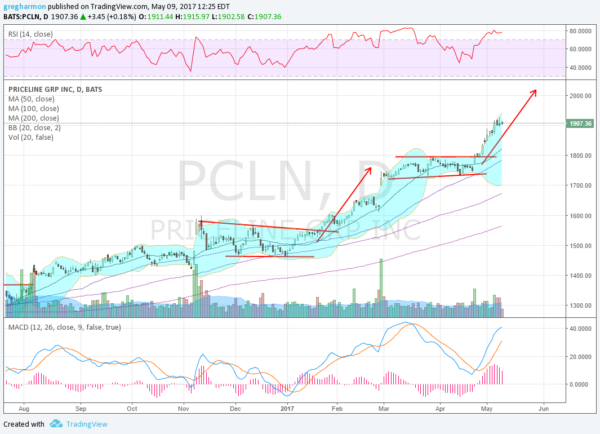
Priceline.com Incorporated (NASDAQ:PCLN) has been the darling of the on line travel industry over the past year. And why not, the stock is up over 40% since breaking out of a base in August last year. The chart below shows the price action since. There was a 3 month consolidation after the election in November that was followed by a 250 move higher. That led to another consolidation that the price broke out of at the end of April. A similar move to the upside would give a target to 2020.
Momentum indicators are running hot into the earnings report tonight. The RSI is in technically overbought territory and the MACD is at the March peak. But like in March, this can work itself out over time without a price pullback, or can just get more overbought. Both moves higher started with a jump off of tight 20 and 50 day SMA’s. Notice that the Bollinger Bands® are opened to the upside, allowing it to rise.
There is support at 1880 and 1806 followed by 1795 and 1735. There is no resistance above the high at 1927. Short interest is moderate at 3.2%, traders know not to short the Shat. The stock has moved about 7.42% after the last 6 reports. That would be about a $141 move at today’s price, giving a range of 1765 to 2050. Wow. The weekly options chain is pricing in a smaller $80 move by Friday, with implied volatility elevated at 56% compared to the June options at 23%. Open interest is largest at the 2000 strike on the Call side, with some size at 1975 as well. On the Put side the biggest open interest is at the 1800 strike with some size trading today at 1810, 1830 and 1850 and 1877.5

Trade Idea 1: Buy the May 12 Expiry 1900/1850/1830 broken wing Put Spread for $16.
Trade Idea 2: Buy the May 12 Expiry 1910/1925 Call Spread ($9) and sell the May 12 Expiry 1815 Puts for free.
Trade Idea 3: Buy the May 12 Expiry/June 2000 Call Calendar ($16) and sell the May 12 Expiry/June 1850 Put Calendar ($14 credit) for $2.
Trade Idea 4: Sell the May 12 Expiry 1800/2000 Strangle for $14 credit.
Trade #1 makes money on a close anywhere below 1884 Friday. Trade #2 gives some upside near the current price and protection down to 1815, near the breakout level. Trade #3 looks for any move higher to stall at 2000 this week and gives short term protection for downside below 1850 this week. Trade #4 is profitable on a close between 1786 and 2014 Friday. I like #1 and #2 the best.
Trades like these are offered everyday to Dragonfly Capital Premium subscribers. Why don’t you consider joining during the The Dragonfly Capital Spring Sale going on now. 20% off an Annual Subscription, 12% off a Quarterly Subscription. And your renewal stays at that sale price.
DISCLAIMER: The information in this blog post represents my own opinions and does not contain a recommendation for any particular security or investment. I or my affiliates may hold positions or other interests in securities mentioned in the Blog, please see my Disclaimer page for my full disclaimer.
