An Ominous Pattern Emerging On Daily Gold Chart

Published 03/15/2021, 10:55 AM
Updated 07/09/2023, 06:31 AM

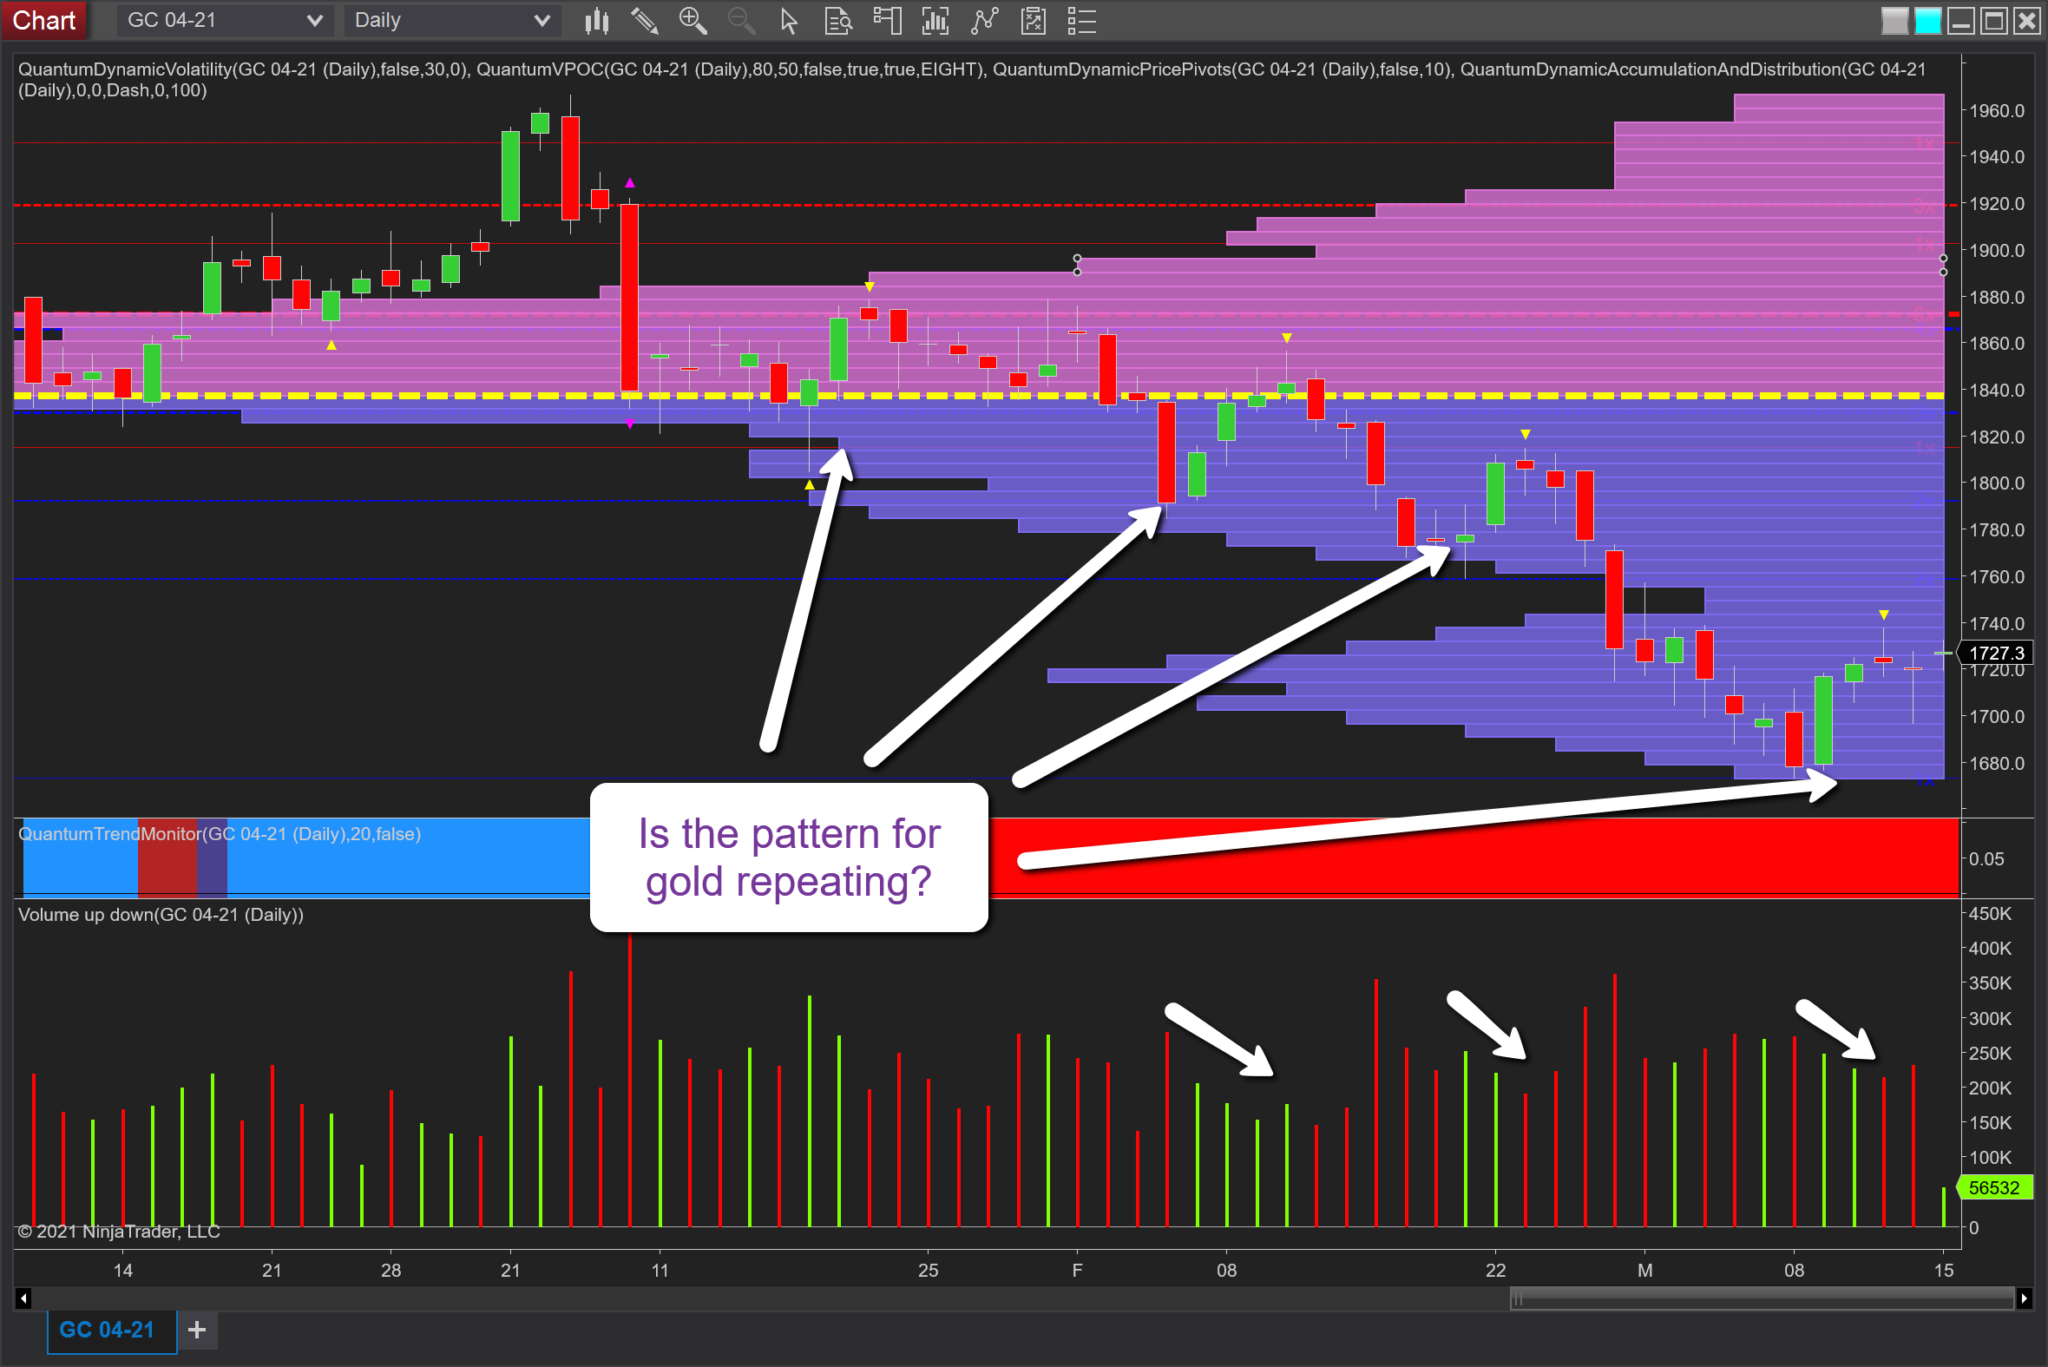
Gold Daily Chart.

A familiar pattern for gold, which I have highlighted before in earlier posts, is emerging. Last week’s price action describes it perfectly once more. The question this time is: Will this rally will indeed be the precursor to something more sustained? Or, will it fizzle out and simply be yet another failure to stem the longer-term bearish trend?

If we take a look back over the last three months, this pattern is clear. We saw a minor recovery in January lifting from the volume point of control (VPOC) at $1,840, which was snuffed out with a subsequent return to the fulcrum of the market.

Then, in February, we witnessed a more pronounced effort. But note how this was accompanied by falling volume, so it did not go far.

At the end of the month, there was another, this time on two candles. But once more, the volume declined.

And finally, we have last week’s effort to rise. But note once again the weakness on falling volume followed by Thursday’s candle, which closed well off the highs on good volume. Friday saw some buying, but probably not enough to influence the longer-term trend. So more downside is likely. For any return to a bullish trend we will need to see some serious buying volumes over an extended period assisted by gold’s role as an inflation hedge.

Latest comments

Loading next article…
Risk Disclosure: Trading in financial instruments and/or cryptocurrencies involves high risks including the risk of losing some, or all, of your investment amount, and may not be suitable for all investors. Prices of cryptocurrencies are extremely volatile and may be affected by external factors such as financial, regulatory or political events. Trading on margin increases the financial risks.
Before deciding to trade in financial instrument or cryptocurrencies you should be fully informed of the risks and costs associated with trading the financial markets, carefully consider your investment objectives, level of experience, and risk appetite, and seek professional advice where needed.
Fusion Media would like to remind you that the data contained in this website is not necessarily real-time nor accurate. The data and prices on the website are not necessarily provided by any market or exchange, but may be provided by market makers, and so prices may not be accurate and may differ from the actual price at any given market, meaning prices are indicative and not appropriate for trading purposes. Fusion Media and any provider of the data contained in this website will not accept liability for any loss or damage as a result of your trading, or your reliance on the information contained within this website.
It is prohibited to use, store, reproduce, display, modify, transmit or distribute the data contained in this website without the explicit prior written permission of Fusion Media and/or the data provider. All intellectual property rights are reserved by the providers and/or the exchange providing the data contained in this website.
Fusion Media may be compensated by the advertisers that appear on the website, based on your interaction with the advertisements or advertisers.
© 2007-2025 - Fusion Media Limited. All Rights Reserved.