‘‘The proper execution of your trades is one of the most fundamental components of becoming a successful trader and probably the most difficult to learn. Most traders find it is much easier to identify something in the market that represents an opportunity, than it is to act upon it.
Can you experience triumph in turbulent markets? In turbulent markets, it is better to be a proficient trader rather than be a long-term investor. When the markets become highly volatile and irrational, long-term investors would probably suffer. For instance, permabulls tend to be worse off in bear markets, and therefore, it would be in the interest of traders to use strategies that work both in bull and bear markets. For you to become triumphant in turbulent markets, you would need a set of high probability Indicators that generate high probability trades (with at least, 40% accuracy). You would need to carry out consistent execution of those trades, and finally, you would need to manage those trades successfully.

Using the Strategy
This strategy comes with a risk-to reward ratio of 1:2.5 – something called a magic formula by one trader and author. With this kind of risk-to-reward ratio, you would be victorious even with a long-term hit rate of 40%. Occasionally, there would be a few losses in a row or a few profits in a row, but you would still be a victor in the long run. The indicators used are Exponential Moving Averages (EMAs), the Relative Strength Index (RSI), and the Force Index (FI). Currency pairs and crosses that tend to trend well have been chosen. You may check the section titled ‘Strategy Snapshot’ in order to check the ‘buy’ and ‘sell’ rules applicable to this trading approach, plus its money and risk management and exit rules. All entry criteria must be met before a trade is opened. Once this has been done, the trade should be exited only according to rules (there are only four exit conditions). These rules are made clear in the trade examples below. Please note that, on each chart, the red vertical line on the left shows where the trade was entered while the red vertical line on the right shows where it was exited.

Strategy Snapshot
Strategy type: Trend-following
Suitability: Good for full-time and part-time traders
Time horizon: Hourly charts
Indicators: EMA 5 (color blue), EMA 12 (color red), RSI 14 period, and FI 14 period
Pairs and crosses: EUR/USD, USD/CHF, GBP/USD, USD/CAD, AUD/USD, NZD/USD, EUR/CHF, EUR/GBP, EUR/JPY, GBP/JPY, EUR/CAD, EUR/NZD, AUD/NZD and NZD/JPY
Buy rule: Enter long when the EMA 5 crosses the EMA 12 to the upside, and the RSI 14 is above the level 50, and the FI 14 is above the level 0.00
Sell rule: Enter short when the EMA 5 crosses the EMA 12 down, and the RSI 14 is below the level 50 and the FI 14 is below the level 0.00
Position size: Use 0.01 lots for each $2,000 (thus making it 0.05 lots for $10,000 and 0.5 lots for $100,000)
Risk per trade: 0.5%
Stop loss: 100 pips
Take profit: 250 pips
Breakeven: Move the initial stop to breakeven after you have gained up to 80 pips
Trailing stop: Apply a custom-set trailing stop of 100 pips after you have gained up to 190 pips
Risk-to-reward: 1:2.5
Survivability: Long-term triumph is possible with 40% hit rate
Exit rule: A trade is closed when the stop loss or breakeven or trailing stop or take profit is hit.
Recent Trade Examples
The examples below include a trade that did not reach its target. All trades cannot be profitable, yet traders can be permanently victorious. The vertical red line on the left shows where a trade was entered while the red vertical line on the right shows where it was exited. You would be shown how risk is controlled effectively in the unpredictable markets. Spreads were not considered in the examples below.
Example 1
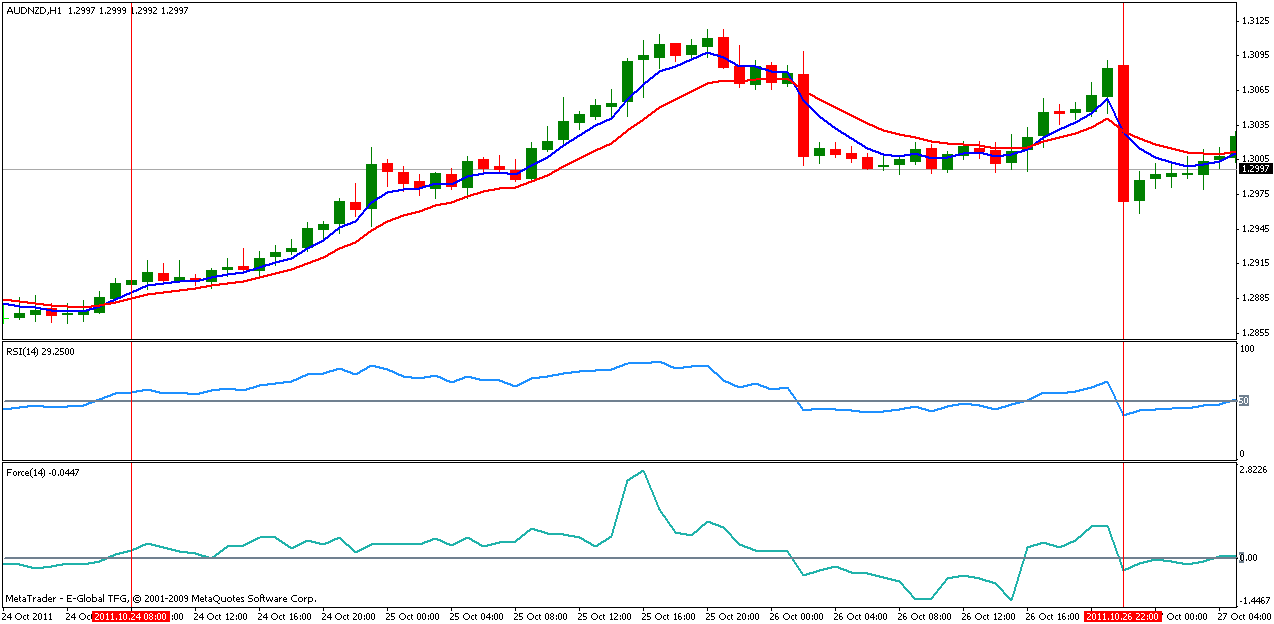
In this example, there was a nice northbound movement after a ‘buy’ signal was generated on the AUD/NZD (Aussie versus the Kiwi). But the price action did not reach the take profit target at 1.3140. A trailing stop of 100 pips was set once the profit reached about 190 pips. The price reversed and hit the trailing stop, thus making the order to be closed with 100-pip profit.
Instrument: AUD/NZD
Order: Buy
Entry date: October 24, 2011
Entry price: 1.2890
Stop loss: 1.2790
Trailing stop: 1.2990
Take profit: 1.3140
Exit date: October 26, 2011
Exit price: 1.2990
Status: Closed
Profit/loss: 100 pips
Conclusion
In order to be capable of investigating the currency market situations more closely, we want to determine exactly when certain signals in market mechanics trends are more successful and when they’re not. Whenever the market mechanics allow signals to be generated, then you enter your positions without being hesitant. From this point on you give the market room, because the swing trading idea becomes a mid-term trend follower. And because you paid a very attractive price for each of your position, it would be a pity to close a favorable position too early. Run your gains.
I’d like to conclude this article with a quote from Steve Ward:
“One of the key aspects that seem to distract traders is excessive focus on P&L and the outcome and results of the trade. That is the trader is so distracted by thoughts around outcome and money to be made/lost that they do not have sufficient focus on the key components of executing their trade to achieve the best outcome. Likewise traders who are low in confidence fail to execute their trades and take opportunities when they arise losing valuable potential profits.”
Can you experience triumph in turbulent markets? In turbulent markets, it is better to be a proficient trader rather than be a long-term investor. When the markets become highly volatile and irrational, long-term investors would probably suffer. For instance, permabulls tend to be worse off in bear markets, and therefore, it would be in the interest of traders to use strategies that work both in bull and bear markets. For you to become triumphant in turbulent markets, you would need a set of high probability Indicators that generate high probability trades (with at least, 40% accuracy). You would need to carry out consistent execution of those trades, and finally, you would need to manage those trades successfully.

Using the Strategy
This strategy comes with a risk-to reward ratio of 1:2.5 – something called a magic formula by one trader and author. With this kind of risk-to-reward ratio, you would be victorious even with a long-term hit rate of 40%. Occasionally, there would be a few losses in a row or a few profits in a row, but you would still be a victor in the long run. The indicators used are Exponential Moving Averages (EMAs), the Relative Strength Index (RSI), and the Force Index (FI). Currency pairs and crosses that tend to trend well have been chosen. You may check the section titled ‘Strategy Snapshot’ in order to check the ‘buy’ and ‘sell’ rules applicable to this trading approach, plus its money and risk management and exit rules. All entry criteria must be met before a trade is opened. Once this has been done, the trade should be exited only according to rules (there are only four exit conditions). These rules are made clear in the trade examples below. Please note that, on each chart, the red vertical line on the left shows where the trade was entered while the red vertical line on the right shows where it was exited.

Strategy Snapshot
Strategy type: Trend-following
Suitability: Good for full-time and part-time traders
Time horizon: Hourly charts
Indicators: EMA 5 (color blue), EMA 12 (color red), RSI 14 period, and FI 14 period
Pairs and crosses: EUR/USD, USD/CHF, GBP/USD, USD/CAD, AUD/USD, NZD/USD, EUR/CHF, EUR/GBP, EUR/JPY, GBP/JPY, EUR/CAD, EUR/NZD, AUD/NZD and NZD/JPY
Buy rule: Enter long when the EMA 5 crosses the EMA 12 to the upside, and the RSI 14 is above the level 50, and the FI 14 is above the level 0.00
Sell rule: Enter short when the EMA 5 crosses the EMA 12 down, and the RSI 14 is below the level 50 and the FI 14 is below the level 0.00
Position size: Use 0.01 lots for each $2,000 (thus making it 0.05 lots for $10,000 and 0.5 lots for $100,000)
Risk per trade: 0.5%
Stop loss: 100 pips
Take profit: 250 pips
Breakeven: Move the initial stop to breakeven after you have gained up to 80 pips
Trailing stop: Apply a custom-set trailing stop of 100 pips after you have gained up to 190 pips
Risk-to-reward: 1:2.5
Survivability: Long-term triumph is possible with 40% hit rate
Exit rule: A trade is closed when the stop loss or breakeven or trailing stop or take profit is hit.
Recent Trade Examples
The examples below include a trade that did not reach its target. All trades cannot be profitable, yet traders can be permanently victorious. The vertical red line on the left shows where a trade was entered while the red vertical line on the right shows where it was exited. You would be shown how risk is controlled effectively in the unpredictable markets. Spreads were not considered in the examples below.
Example 1
In this example, there was a nice northbound movement after a ‘buy’ signal was generated on the AUD/NZD (Aussie versus the Kiwi). But the price action did not reach the take profit target at 1.3140. A trailing stop of 100 pips was set once the profit reached about 190 pips. The price reversed and hit the trailing stop, thus making the order to be closed with 100-pip profit.
Instrument: AUD/NZD
Order: Buy
Entry date: October 24, 2011
Entry price: 1.2890
Stop loss: 1.2790
Trailing stop: 1.2990
Take profit: 1.3140
Exit date: October 26, 2011
Exit price: 1.2990
Status: Closed
Profit/loss: 100 pips
Conclusion
In order to be capable of investigating the currency market situations more closely, we want to determine exactly when certain signals in market mechanics trends are more successful and when they’re not. Whenever the market mechanics allow signals to be generated, then you enter your positions without being hesitant. From this point on you give the market room, because the swing trading idea becomes a mid-term trend follower. And because you paid a very attractive price for each of your position, it would be a pity to close a favorable position too early. Run your gains.
I’d like to conclude this article with a quote from Steve Ward:
“One of the key aspects that seem to distract traders is excessive focus on P&L and the outcome and results of the trade. That is the trader is so distracted by thoughts around outcome and money to be made/lost that they do not have sufficient focus on the key components of executing their trade to achieve the best outcome. Likewise traders who are low in confidence fail to execute their trades and take opportunities when they arise losing valuable potential profits.”
