
Biotech major Amgen Inc. (NASDAQ:AMGN) reported third-quarter 2017 earnings of $3.27 per share, which beat the Zacks Consensus Estimate of $3.09 by 5.8%. Earnings increased 8% from the year-ago period backed by lower operating costs, which offset the year-over-year sales decline.
Including costs related to discontinuation of a pipeline candidate (AMG 899, an oral CETP inhibitor), reported earnings were $2.76 per share, up 3% year over year.
Total revenue of $5.77 billion in the quarter slightly beat the Zacks Consensus Estimate of $5.74 billion. Revenues declined 1% year over year. An unfavorable impact of foreign exchange hurt sales by 1% in the quarter.
While U.S. revenues declined 2%, ex-U.S. sales grew 5%, excluding currency headwinds.
Quarter in Detail
Total product revenue declined 1% (including negative currency impact of 1%) from the year-ago quarter to $5.45 billion (U.S.: $4.3 billion; ex-U.S.: $1.16 billion) as strong demand for newer products like Prolia, Kyprolisand Blincyto was not enough to make up for lower sales of mature brands like Enbrel, Epogen, Neulasta and Neupogen due to competitive pressure.
Revenues of Amgen’s erythropoiesis-stimulating agent (ESA), Aranesp, declined 3% from the year-ago quarter to $516 million due to lower demand.
Revenues of the other ESA, Epogen, declined 21% to $264 million due to lower selling price owing to a recently negotiated contract with DaVita Inc. Unfavorable changes in inventory also hurt Epogen sales.
Neulasta revenues declined 6% to $1.12 billion from the year-ago period dueto unfavorable shift in timing of purchases by some large customersand increased competition from PD-1s and other new cancer therapies. However, the Neulasta Onpro kit (on-body injector) continues to perform well, commanding a market share of about 56% in the United States for all Neulasta sales.
Neupogen recorded a 25% decline in sales to $138 million due to biosimilar competition in the United States. Zarxio, Sandoz’s (Novartis’ (NYSE:NVS) generic arm) biosimilar version of Neupogen, was launched in the United States in September 2015 and is hurting sales.
Enbrel delivered revenues of $1.36 billion, down 6% from the year-ago quarter due to lower selling prices and increased competition, which hurt demand.
Enbrel lost market share by less than 1 point in both the rheumatology and dermatology segments.
Prolia revenues came in at $464 million, up 22% from the year-ago quarter due to higher demand. The osteoporosis drug witnessed market share gains in both the United States and international markets.
Meanwhile, Xgeva delivered revenues of $387 million, down 2% from the year-ago quarter mainly due to unfavorable shift in timing of purchases by some large customers.
Sensipar/Mimpara revenues increased 10% to $457 million due to higher price increases.
Vectibix revenues came in at $168 million, up 2%, driven by higher demand.
Kyprolis recorded sales of $207 million, up 13% year over year driven by higher demand and robust uptake from outside U.S. markets.
Amgen’s regulatory applications in the United States and EU to include overall survival data from the ENDEAVOR study on the label of Kyprolis are under review. The study demonstrated that a combination of Kyprolis plus dexamethasone led to superior overall survival when compared to Velcade plus dexamethasone. This overall survival data, if approved, can help drive usage and boost sales of Kyprolis. The FDA is expected to give its decision on Apr 30 next year.
Blincyto sales surged 79% from the year-ago period to $52 million, reflecting higher demand. In July, the FDA approved the inclusion of overall survival data from the TOWER study on the label of Blincyto to convert the accelerated approval to a full approval. The addition of the data must have boosted sales.
Amgen’s PCSK9 inhibitor, Repatha generated revenues of $89 million, not a very significant improvement from $83 million in the second quarter. Changes in inventory and accounting adjustments that favourably affected second-quarter sales were missing in the third quarter.
Uptake of the drug, which gained FDA approval in August 2015, has not been very encouraging so far due to pricing and re-imbursement issues/payer restrictions. Sanofi (NYSE:SNY) and partner Regeneron Pharmaceuticals (NASDAQ:REGN) also faced similar issues with their PCSK9 inhibitor, Praluent. The priority for Amgen right now is to improve patient access to Repatha.
Amgen’s regulatory applications to include data from the phase III cardiovascular outcomes study (FOURIER) on Repatha’s label is under priority review with a decision from the FDA expected on Dec 2. We remind investors that data from the FOURIER study, presented in the first quarter, had revealed significant reduction in myocardial infarctions and strokes. The data is key to commercial success of Repatha as it will broaden the use of the drug. Though data from the study looks good, it is not very clear if payers will be willing to improve access to Repatha based on this data.
Operating Margins Increase
Adjusted operating margins rose 270 basis points (bps) to 55.6% due to lower operating costs, reflecting continued benefits from transformation and process improvement efforts.
R&D expenses declined 11% in the quarter due to lower late-stage pipeline related costs and lower upfront payments for in-licensing transactions than third quarter of last year. SG&A spend declined 6% due to the October 2016 expiration of Enbrel residual royalty payments, which offset investments to support new product launches.
Amgen bought back shares worth $0.8 billion in the quarter. This month, Amgen’s board of directors approved a new share buyback plan of $5 billion.
2017 Guidance
While Amgen slightly raised the lower end of the previously issued sales outlook, it raised the earnings guidance on the back of effective cost management.
The company expects total revenue in the range of $22.7 billion to $23.0 billion compared with $22.5 billion to $23.0 billion expected previously. Adjusted earnings are now expected in the range of $12.50 to $12.70 in 2017 compared with $12.15 to $12.65 per share expected previously.
However, the company tightened its reported earnings guidance to a range of $10.96-$11.20 per share from $10.79-$11.37 to account for the costs related to the hurricane recovery efforts at its Puerto Rico manufacturing facility. Though the company does not expect any negative impact on product supply, the expenses related to Hurricane Maria are expected to hurt earnings per share by 15-18 cents.
Operating expenses are expected to be higher in the fourth quarter than the third.
Our Take
Though Amgen beat expectations for both earnings and sales and raised its earnings guidance for the full year, shares lost more than 1% in after-market trading due to the decline in sales and probably due to disappointing sales of Repatha, a key new drug. However, so far this year, Amgen’s shares are up 21.4%, better than the 6.9% increase registered by the industry.

Though Amgen’s newer products – Prolia, Xgeva, Vectibix, Nplate and Sensipar – are all performing well, their volume growth may not be enough to offset the decline in mature brands like Enbrel due to competitive pressure. However, Amgen’s restructuring plan should make it leaner and more cost efficient. Amgen is also progressing with its pipeline, including biosimilar drugs.
Amgen currently carries a Zacks Rank #3 (Hold). You can see the complete list of today’s Zacks #1 Rank (Strong Buy) stocks here.
Amgen Inc. Price, Consensus and EPS Surprise
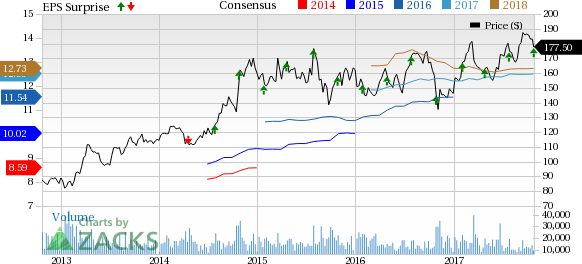
Amgen Inc. Price, Consensus and EPS Surprise | Amgen Inc. Quote
Looking for Stocks with Skyrocketing Upside?
Zacks has just released a Special Report on the booming investment opportunities of legal marijuana.
Ignited by new referendums and legislation, this industry is expected to blast from an already robust $6.7 billion to $20.2 billion in 2021. Early investors stand to make a killing, but you have to be ready to act and know just where to look.
See the pot trades we're targeting>>
Sanofi (SNY): Free Stock Analysis Report
Novartis AG (NVS): Free Stock Analysis Report
Regeneron Pharmaceuticals, Inc. (REGN): Free Stock Analysis Report
Amgen Inc. (AMGN): Free Stock Analysis Report
Original post
Zacks Investment Research