
AMETEK Inc.’s (NYSE:AME) second-quarter 2017 earnings of 65 cents per share came ahead of the Zacks Consensus Estimate by 3 cents. Earnings increased 8.3% sequentially and 10.2% year over year.
The company’s revenues were positively impacted by robust organic growth and input from recently completed acquisitions.
The solid performance was particularly driven by an increase in sales and operational-excellence initiatives. This, in combination with a strong portfolio of differentiated businesses, is expected to help the company post better results, going forward.
The company continues to reap the benefits from the execution of its four core growth strategies of operational excellence, global market expansion, investments in product development and strategic acquisitions.
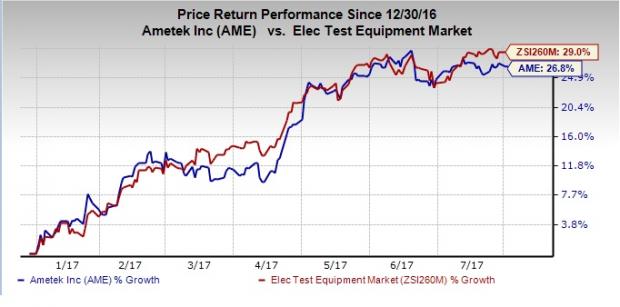
However, AMETEK's shares have returned only 26.8% year to date, underperforming the industry’s gain of 29.0%.
Numbers in Detail
Total Revenue
AMETEK reported revenues of $1.06 billion, up 8.9% year over year. Revenues came ahead of the Zacks Consensus Estimate of $1.03 billion.
The company has two operating segments — Electronic Instruments Group (EIG) and Electromechanical Group (EMG) — which accounted for 62% and 38%, respectively, of total revenue in the second quarter.
Revenues by Segment
Revenues of EIG increased 10.3% on a year-over-year basis to $657.7 million. The year-over-year increase was due to robust core growth and contribution from the acquisitions of Nu Instruments, HS Foils and Rauland.
EMG sales were up 6.6% on a year-over-year basis to $406.9 million. The year-over-year improvement was primarily due to solid core growth across Differentiated and Floorcare businesses and contribution from Laserage acquisition.
Operating Performance
AMETEK’s gross margin for the quarter was 34.3%, down 30 bps from 34.6% a year ago.
The company reported operating income of $232.4 million, higher than the year-ago quarter figure of $219.0 million.
Selling, general and administrative expenses of $132.5 million increased 11.4% year over year. Also, as a percentage of sales, selling, general and administrative expenses increased. As a result, operating margin of 21.8% was down 30 bps year over year.
Net Income
AMETEK’s net income was $150.5 million compared with $138.9 million in the previous quarter and $138.2 million in the year-ago period.
Earnings of 65 cents per share were higher than 60 cents in the prior quarter and 59 cents reported in the year-ago quarter.
Balance Sheet
Cash and cash equivalents balance at the end of the second quarter was $516.5 million, decreasing from $570.2 million in the previous quarter. Long-term debt was $2.13 billion, up from $2.08 billion in the previous quarter.
Outlook
For the third quarter, management expects revenues to be up 10% year over year. Earnings are expected to be in the range of 60–62 cents per share, up 7–11% year over year. For the third quarter, the Zacks Consensus Estimate is pegged at 61 cents.
For 2017, management increased its revenue growth forecast to high-single digits from the previous expectation of mid-single digits over 2016. Earnings are expected to be in the range of $2.46–$2.52 per share, up 7–10% year over year from its previous expectations of $2.40 to $2.48. The Zacks Consensus Estimate for 2017 is pegged at $2.48.
AMTEK, Inc. Price, Consensus and EPS Surprise
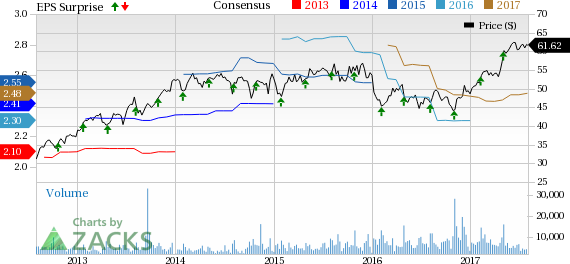
AMTEK, Inc. Price, Consensus and EPS Surprise | AMTEK, Inc. Quote
Zacks Rank and Other Stocks to Consider
Currently, AMETEK has a Zacks Rank #3 (Hold). Some better-ranked stocks in the same space are Lam Research Corporation (NASDAQ:LRCX) , carrying a Zacks Rank #1 (Strong Buy), and Applied Materials (NASDAQ:AMAT) and Fortive Corporation (NYSE:FTV) , carrying a Zacks Rank #2 (Buy). You can see the complete list of today’s Zacks #1 Rank stocks here.
Lam Research delivered a positive earnings surprise of 4.44%, on average, in the trailing four quarters.
Applied Materials delivered a positive earnings surprise of 3.35%, on average, in the trailing four quarters.
Fortive Corporation delivered a positive earnings surprise of 5.80%, on average, in the trailing four quarters.
More Stock News: Tech Opportunity Worth $386 Billion in 2017
From driverless cars to artificial intelligence, we've seen an unsurpassed growth of high-tech products in recent months. Yesterday's science-fiction is becoming today's reality. Despite all the innovation, there is a single component no tech company can survive without. Demand for this critical device will reach $387 billion this year alone, and it's likely to grow even faster in the future.
Zacks has released a brand-new Special Report to help you take advantage of this exciting investment opportunity. Most importantly, it reveals 4 stocks with massive profit potential. See these stocks now>>
Lam Research Corporation (LRCX): Free Stock Analysis Report
Applied Materials, Inc. (AMAT): Free Stock Analysis Report
AMTEK, Inc. (AME): Free Stock Analysis Report
Fortive Corporation (FTV): Free Stock Analysis Report
Original post