American International Group, Inc. (AIG) is an international insurance company, serving customers in more than 130 countries. AIG companies serve commercial, institutional and individual customers through property-casualty networks of any insurer.
This is an order flow note along side with some rising vol. I actually found AIG because of its vol pop today. Let's start with the news:
Shares in American International Group, Inc. were up 2.2% this morning at $29.70 after analysts at Deutsche Bank predicted the insurer’s stock buyback program may be larger and more rapid than is implied by the current share price. -- Source: Forbes via yahoo! Finance -- Options Players Bet On Big Upside In AIG, Under Armour, by Caitlin Duffy.
The order flow has pushed front expiry skew to the upside. The company has traded 91,935 contracts on total daily average option volume of just 18,922, with calls trading on a nearly 10:1 ratio to puts. The Mar (weekly)31 calls have traded more than 12,000x and are pushing skew. The Stats Tab and Day's biggest trades snapshots are included (below).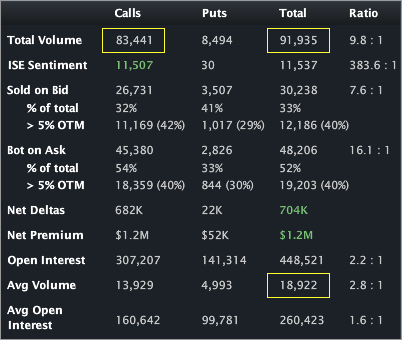

The Options Tab (below) illustrates that the calls are opening (compare trade size to OI). From what I see, the trades look to be substantially purchases.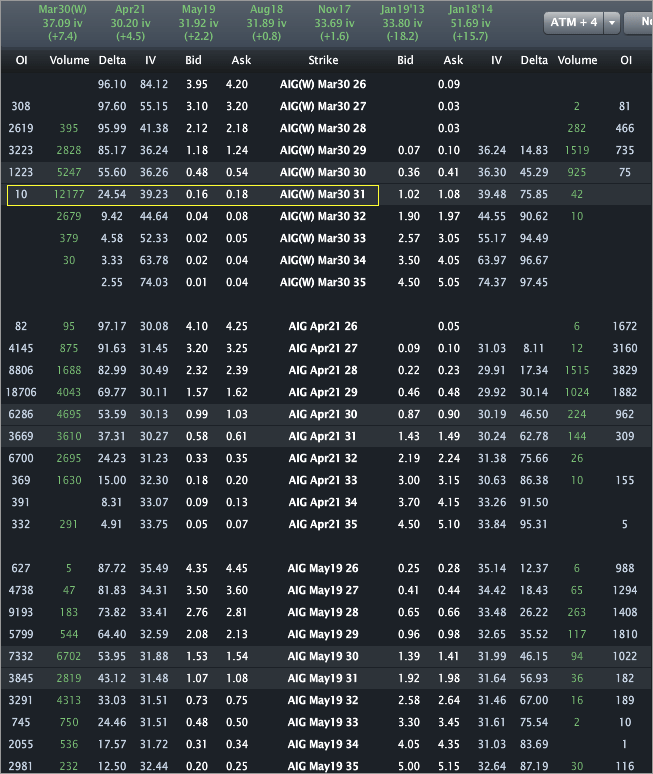
The Skew Tab snap (below) illustrates the vols by strike by month.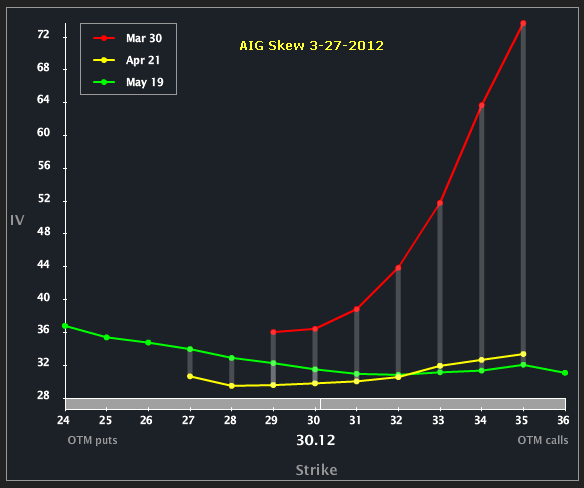
This is the first part of the vol story which caught my attention. We can see a rather abrupt upside skew in the weeklies. Granted, some of that is artificially elevated due to some cab bids in the OTM calls -- but in general, the shape has certainly changed from a few days ago. I've included the skew chart from two days ago, below.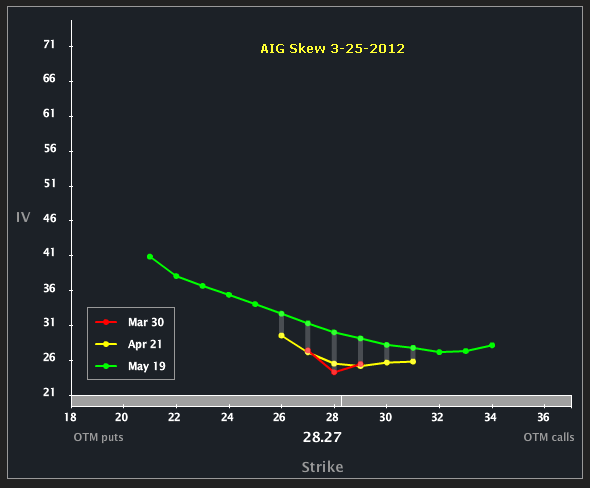
We can see that two days ago the skew was rather flat -- the news and resulting order flow have had an impact on the skew shape.
Finally, the Charts Tab (six months) is below. The top portion is the stock price, the bottom is the vol (IV30™ - red vs HV20™ - blue vs HV180™ - pink).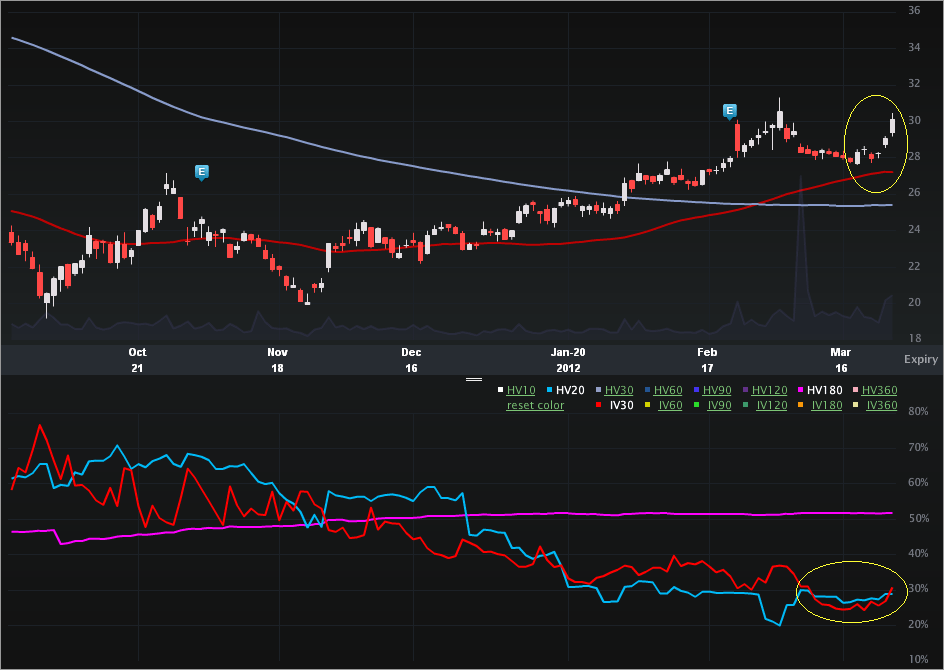
The second part of the vol story comes from a more holistic view. Check out how depressed the implied is right now relative to its own history. The 52 wk range in IV30™ is [24.41%, 84.91%], putting the current level in the 10th percentile (annual). Obviously AIG's vol has dropped with the rest of the market (read: VIX is 15%). The next earnings release for AIG should be in early May if dates of the last two years' earnings dates (5-7-2010 and 5-5-2011) are a good indication for this year.
It is interesting to note that, unlike a few of the other recent posts, the May vol (earnings vol) is essentially the same as the expiry before (Apr). The 31.92% in May would still be in 12th percentile (annual). One caveat here, the implied got sorta wildly elevated around Oct of 2011. Other than that "moment" in time, the implied peaked at ~60%.
This is trade analysis, not a recommendation.
- English (UK)
- English (India)
- English (Canada)
- English (Australia)
- English (South Africa)
- English (Philippines)
- English (Nigeria)
- Deutsch
- Español (España)
- Español (México)
- Français
- Italiano
- Nederlands
- Português (Portugal)
- Polski
- Português (Brasil)
- Русский
- Türkçe
- العربية
- Ελληνικά
- Svenska
- Suomi
- עברית
- 日本語
- 한국어
- 简体中文
- 繁體中文
- Bahasa Indonesia
- Bahasa Melayu
- ไทย
- Tiếng Việt
- हिंदी
American International Group: Stock Rises, Vol Pops, Skew Bends, Calls Trade
Published 03/28/2012, 05:14 AM
Updated 07/09/2023, 06:31 AM
American International Group: Stock Rises, Vol Pops, Skew Bends, Calls Trade
Latest comments
Loading next article…
Install Our App
Risk Disclosure: Trading in financial instruments and/or cryptocurrencies involves high risks including the risk of losing some, or all, of your investment amount, and may not be suitable for all investors. Prices of cryptocurrencies are extremely volatile and may be affected by external factors such as financial, regulatory or political events. Trading on margin increases the financial risks.
Before deciding to trade in financial instrument or cryptocurrencies you should be fully informed of the risks and costs associated with trading the financial markets, carefully consider your investment objectives, level of experience, and risk appetite, and seek professional advice where needed.
Fusion Media would like to remind you that the data contained in this website is not necessarily real-time nor accurate. The data and prices on the website are not necessarily provided by any market or exchange, but may be provided by market makers, and so prices may not be accurate and may differ from the actual price at any given market, meaning prices are indicative and not appropriate for trading purposes. Fusion Media and any provider of the data contained in this website will not accept liability for any loss or damage as a result of your trading, or your reliance on the information contained within this website.
It is prohibited to use, store, reproduce, display, modify, transmit or distribute the data contained in this website without the explicit prior written permission of Fusion Media and/or the data provider. All intellectual property rights are reserved by the providers and/or the exchange providing the data contained in this website.
Fusion Media may be compensated by the advertisers that appear on the website, based on your interaction with the advertisements or advertisers.
© 2007-2025 - Fusion Media Limited. All Rights Reserved.
