AMD’s Crypto-Inspired Stock Chart Looks Promising

Published 01/04/2018, 07:56 AM
Updated 07/09/2023, 06:31 AM

The biggest profits during the gold rush of the 19th century were made by those selling picks and shovels. Similarly, graphics cards providers are currently making a killing as the crypto mania inspires a lot of people to spend big on mining equipment. As Intel (NASDAQ:INTC) stock keeps tracking the Elliott Wave path, it is time to take a look at the price chart of Advanced Micro Devices (NASDAQ:AMD) Inc. or simply AMD.
AMD Stock Elliott Wave Analysis

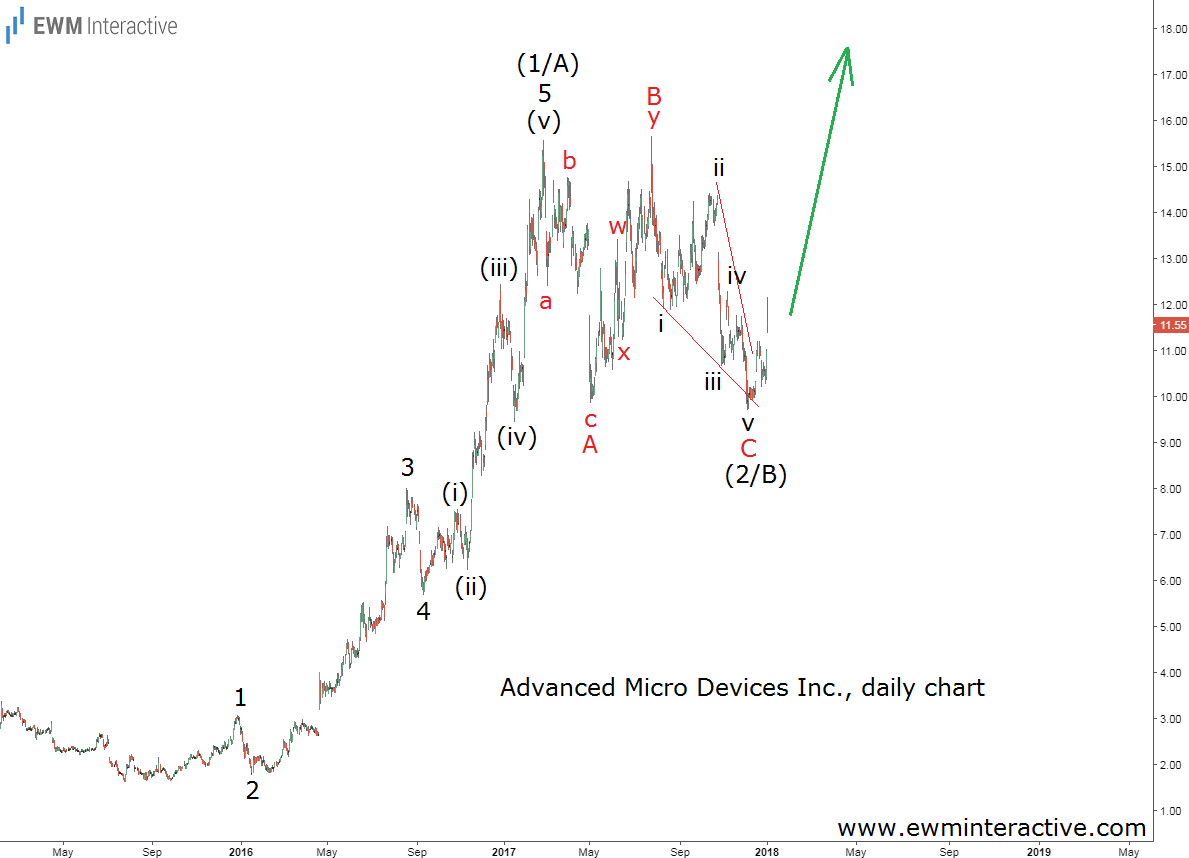
The daily chart of AMD stock visualizes its entire price development since the low at $1.61 in July, 2015. By late-February, 2017, the stock had climbed by as much as 866% to as high as $15.55. What interests us as Elliott Wave analysts is the fact that this impressive rally could be seen as a five-wave impulse, which comes to tell us that AMD is in an uptrend. However, every impulse is followed by a correction of three waves in the opposite direction. AMD’s corrective decline appears to be an A-B-C expanding flat correction with an ending diagonal in the position of wave C.

If this count is correct, the 5-3 wave cycle is complete and the trend is supposed to resume in the direction of the impulsive pattern. Wave (3/C) has the potential to exceed the top of wave (1/A), which means levels above $15.55 could be expected from now on, giving the stock 35% upside potential from current levels. Unless the Bitcoin bubble pops, of course.

Original post

Latest comments

Loading next article…
Risk Disclosure: Trading in financial instruments and/or cryptocurrencies involves high risks including the risk of losing some, or all, of your investment amount, and may not be suitable for all investors. Prices of cryptocurrencies are extremely volatile and may be affected by external factors such as financial, regulatory or political events. Trading on margin increases the financial risks.
Before deciding to trade in financial instrument or cryptocurrencies you should be fully informed of the risks and costs associated with trading the financial markets, carefully consider your investment objectives, level of experience, and risk appetite, and seek professional advice where needed.
Fusion Media would like to remind you that the data contained in this website is not necessarily real-time nor accurate. The data and prices on the website are not necessarily provided by any market or exchange, but may be provided by market makers, and so prices may not be accurate and may differ from the actual price at any given market, meaning prices are indicative and not appropriate for trading purposes. Fusion Media and any provider of the data contained in this website will not accept liability for any loss or damage as a result of your trading, or your reliance on the information contained within this website.
It is prohibited to use, store, reproduce, display, modify, transmit or distribute the data contained in this website without the explicit prior written permission of Fusion Media and/or the data provider. All intellectual property rights are reserved by the providers and/or the exchange providing the data contained in this website.
Fusion Media may be compensated by the advertisers that appear on the website, based on your interaction with the advertisements or advertisers.
© 2007-2025 - Fusion Media Limited. All Rights Reserved.