BEARISH SIGNAL
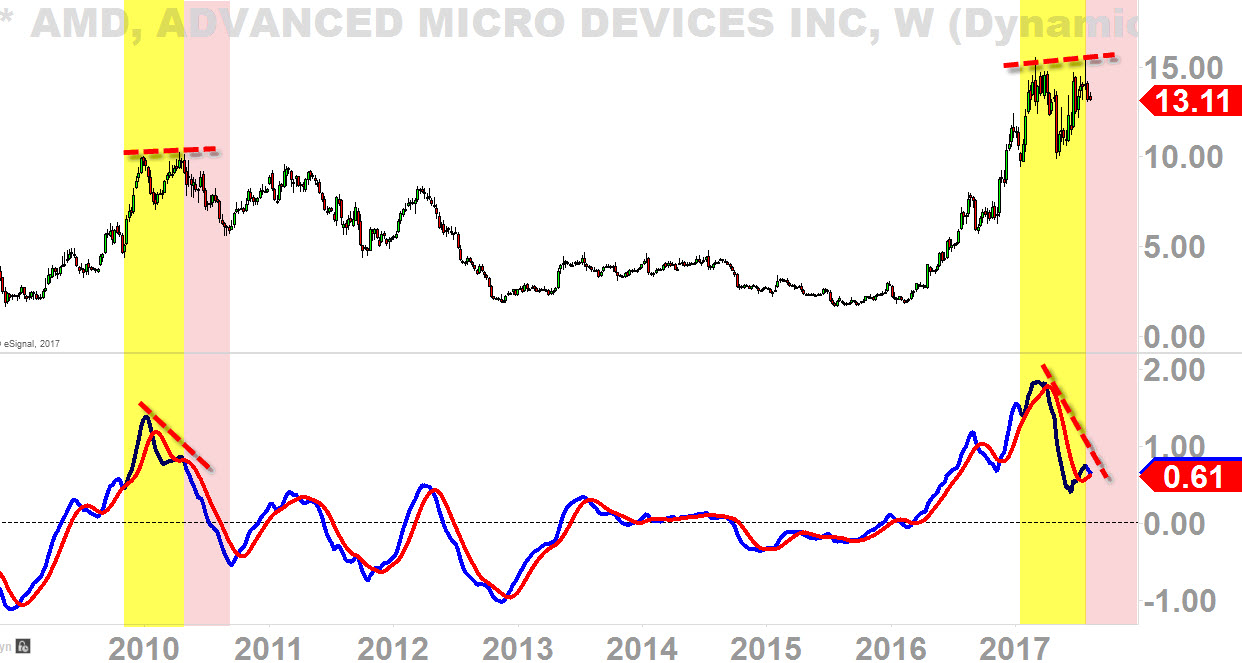
Double top that has been fueled with negative divergence could be a recipe for a disaster, especially a cheap stock like AMD.
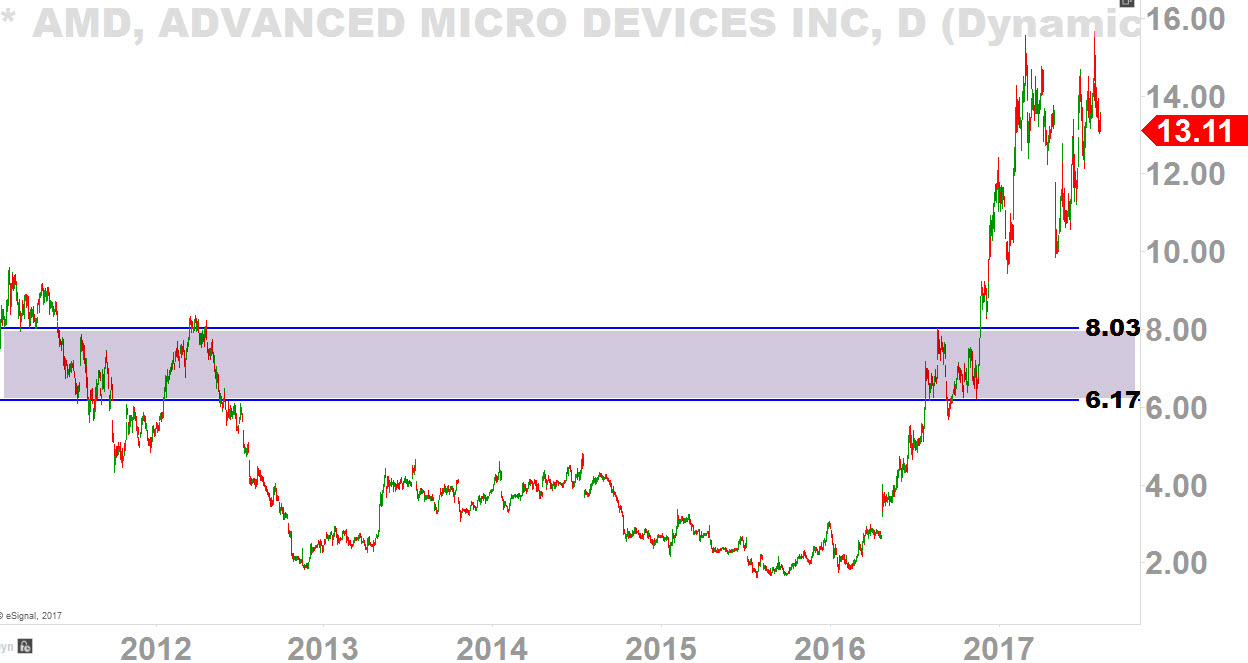
I've been watching AMD ever since it cleared above the $8 - $10 major pivot level (back in December of 2016) breaking out above the 8-year range it has been in since 2008.
I generally despise going long on a breakout, so I've decided not to pull the trigger upon that breakout.
Truthfully, ever since then, I've been secretly hoping for a correction (no offense to AMD investors) so I can start to accumulate positions.
Well, maybe my wish might just come to a fruition once for all.
As you can see in the chart below, we have pretty steep bearish divergence happening on MACD here. This is the pattern that killed AMD when it topped out in 2010.
After this pattern was confirmed, AMD got into a bear market for a whopping 3 years (2010 - 2013) and then, afterwards, it got into a sideways dead-move for another 3 years (2013 - 2016).
For sure it was scary pattern for the investors back then and it is a scary pattern for the investors now.
Well, the scary monster is back today even with scarier look on MACD as you can see that it has much steeper decline than 2010 MACD.
This is the pattern that might just kill the AMD stock value to half.

MAJOR SUPPORTS
So what are the levels we can possibly look for a strong support? I have reasons to believe that $8 to $6ish could provide as strong support.
Yes, I know that's a pretty big spread, but when you are dealing with these kind of patterns (discussed above) along with so much optimism/hype that is starting to die off here, it's very difficult to pin point the exact level.
I also believe that $8 - $6 level are the levels to hold for the uptrend to possibly continue to the upside; because if we lose the level ($8 - $6), AMD may never recover and it may be up for another 3-5 years of bear market just like what happened in 2010.
That's why it's crucial that buyers protect the $8 - $6 level to maintain integrity of this uptrend to keep the momentum going for the primary-term perspective to stay in bullish sentiment.
If, indeed, the price falls to $8, I will be looking to purchase stocks within the range of $8 - $6.00.

BONUS CHART
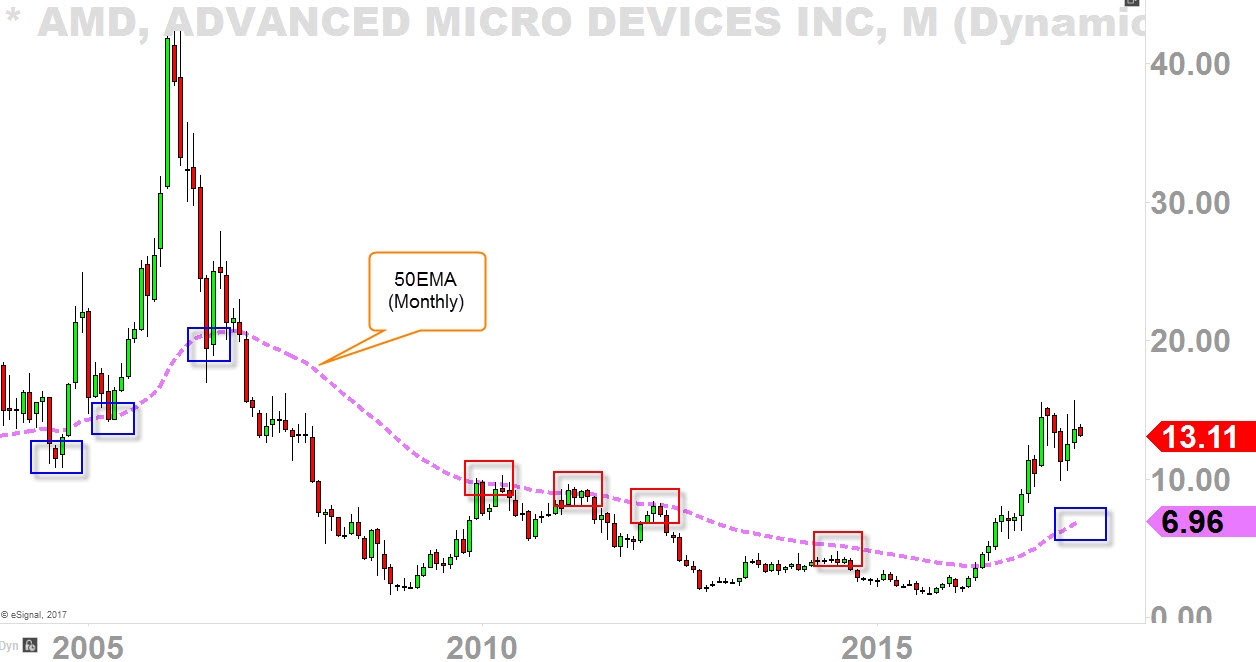
As my follower @howeibinmentioned, "50EMA (Monthly)" has been served as a major pivot level since 2005.
- 2005, acted as strong support (blue boxes)
- 2010 - 2015, acted as strong resistance (red boxes)
- Currently residing at $7ish
If the price falls to "50EMA (Monthly)" at around 7, I believe it will act as strong support

