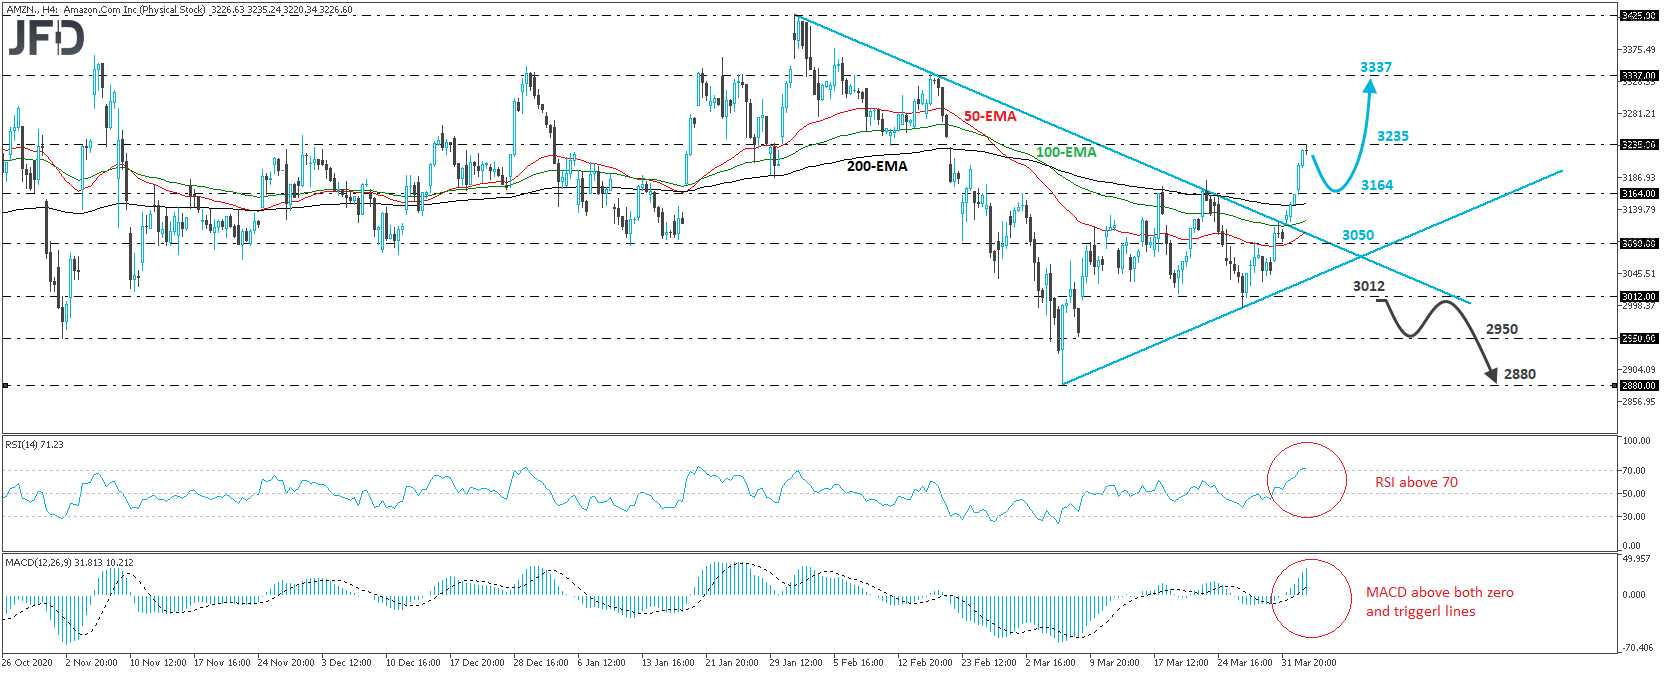
Amazon (NASDAQ:AMZN) has been in a rally mode since last Wednesday, breaking above the downside resistance line drawn from the high of Feb. 2. At the same time the stock is trading above a newly formed upside line taken from the low of Mar. 5. All these technical signs paint a positive short-term picture, in our view.
At the time of writing, the price is testing the 3235 barrier, which is marked as a resistance by the inside swing low of Feb. 12. If investors are willing to push the action past that zone, we may see them aiming for the high of Feb. 18, at 3337. However, given the latest rally, we could see a small setback before the next leg north, perhaps for the share to test the 3164 support barrier.
Shifting attention to our short-term oscillators, we see that RSI runs above its 70 line, but has started to show signs of topping, while the MACD lies above both its zero and trigger lines. Both indicators detect strong upside speed, but the fact that the RSI has started to top, adds more credence to our view that a pullback may be in the works.
However, in order to abandon the bullish case, we would like to see Amazon falling below the 3012 support zone, marked near the low of Mar. 19, and slightly above the low of Mar. 26. This will take the price below both the aforementioned diagonal lines, and may initially pave the way towards the low of Mar. 8, at 2950. Another dip, below 2950 may carry more bearish implications, perhaps setting stage for the low of Mar. 5, at 2880.
