Earlier today subscribers received this article with how to participate in Amazon (NASDAQ:AMZN) and Starbucks (NASDAQ:SBUX) earnings. I traded Amazon call flys for $2.15 on a variation on trade #3 below (405/420/435) on the stream, and Starbucks trade #2 for 19c. The initial reaction shows Starbucks moving higher while Amazon popped and then dropped.
Two names today that report after the close tonight, Amazon.com (NASDAQ:AMZN) and Starbucks (NASDAQ:SBUX).
-
Amazon

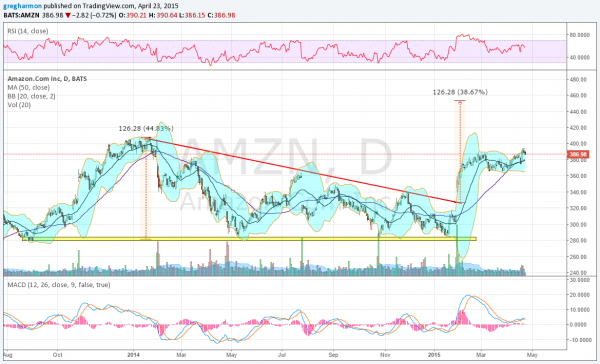
Amazon broke out of a descending triangle to the upside after their last report. The stock rose to close the gap from January 2014 and has paused, consolidating about halfway to the target of the breakout at 453. Heading into earnings it is testing the top of that consolidation, with Bollinger Bands® expanding, an RSI in the bullish range but pointing lower short term, and the MACD rising. These point to an upward bias. There is support lower at 379 and 366 followed by 360 and 342 before a gap to fill to 311. There is resistance above at 391 and 408. The reaction to the last 6 earnings reports has been a move of about 10.33% on average or $40 making for an expected range of 347 to 427. The at-the money weekly April Straddles suggest a smaller $32.50 move by Expiry tomorrow with Implied Volatility at 16% above the May at 49%. Short interest is low at 1.6%. Open interest is very large above at the 390 Strike and below the 385 and 375 Strikes are biggest.
Trade Idea 1: Buy the April 390/420 Call Spread for $10.
Trade Idea 2: Buy the April 400/417.5 1×2 Call Spread for free.
Trade Idea 3: Buy the April 400/417.5/435 Call Butterfly for $2.
Trade Idea 4: Sell the April 350/420 Strangle for a $7.25 credit.
Trade Idea 5: Sell the April 345 Put for a $2.20 credit.
#1, #2 and #3 give the short term upside, with #2 using margin. #4 gives a profitable range from 342.75 to 427.25. I prefer #2 or #3 paired with #5 to lower the cost. Best if you are comfortable owning the stock at 345.
-
Starbucks

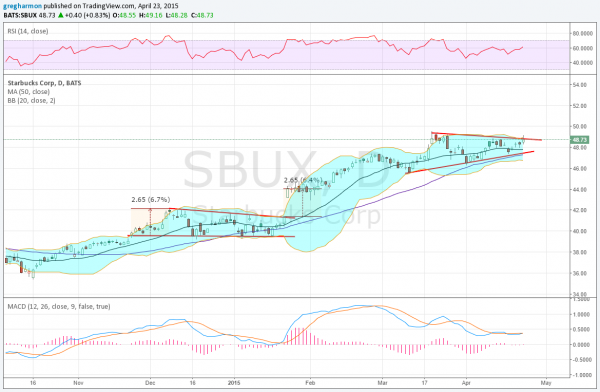
Starbucks has been moving higher since October. After reaching the target of the move out of a descending triangle in January, it paused before the latest move higher. That has resulted in a symmetrical triangle consolidation since March. Into earnings it is testing the top of the triangle and a move over that would target 52.80. The RSI is bullish and rising and the MACD is about to cross up as well. There is support lower at 48 and 47.40 followed by 46.50 and 45.50 before 43.60. There is no resistance higher over 49.40. The reaction to the last 6 earnings reports has been a move of about 3.28% on average or $1.60 making for an expected range of 47.15 to 50.40. The at-the money weekly April Straddles suggest a larger $1.70 move by Expiry with Implied Volatility at 66% above the May at 24%. Short interest is low under 1%. Open interest favors the 49 to 50 Strike range in April.
Trade Idea 1: Buy the April 49/50 Call Spread for $0.40
Trade Idea 2: Buy the April 49/50/51 Call Butterfly for 23 cents.
Trade Idea 3: Buy the April 48.25/47.5 1×2 Put Spread for a 5 cent credit.
Trade Idea 4: Buy the April/May 50 Call Calendar (30 cents) and sell the May 8 Expiry 46 Puts (30 cents) for free.
#1 and #2 look for a move higher but not above 50 in April. #3 gives downside side and a possible entry at 46.75. #4 gives longer term upside, looking for 50 to stop it this week, and risk below 46. I like #2 best (you can add #3 if want to own it too) or #4.
The information in this blog post represents my own opinions and does not contain a recommendation for any particular security or investment. I or my affiliates may hold positions or other interests in securities mentioned in the Blog, please see my Disclaimer page for my full disclaimer.
