Numerous factors weigh heavily on the base metals and commodity complex: the Chinese copper scrap ban, the Section 232 proclamation on aluminum and steel combined with country-specific exemptions set to expire on May 1, the Section 301 investigation, and multiple strikes at copper and nickel mines to boot. After the turmoil of the first few months of 2018, MetalMiner reviews how base metals and commodities performed during Q1.
Aluminum, copper and nickel on the rise
Aluminum, copper and nickel prices started 2018 weaker than at the end of 2017. The end of 2017 showed a sharp rally for these base metals, following the bullish uptrend that began in the summer of 2017.
The short-term downtrend sounded alarms as prices dropped significantly, not finding a floor. However, LME prices started to climb at the beginning of April, leaving the downtrend behind.
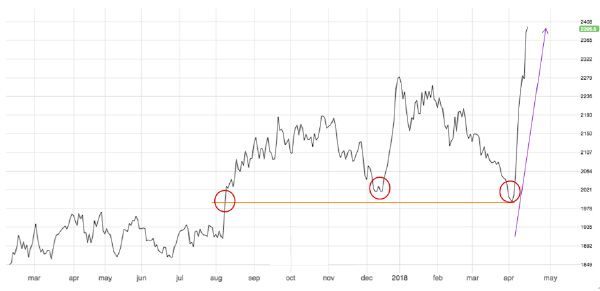
So far, aluminum has been April’s top performer. LME aluminum prices have already climbed by more than 21%. Aluminum prices seem strong enough to continue this uptrend, based on trading volumes and price behavior. In the most recent price movement, fundamentals — particularly the recent sanctions imposed on Russia — could lead to an aluminum supply shortage.

Source: MetalMiner analysis of FastMarkets, LME aluminum price, March 2017-April 2018.
Buying organizations had the opportunity to buy some volume at the beginning of this month before the price spike, when prices had held closer to support levels. The red circles in the chart above show the buying dips for aluminum. In bull markets, buying organizations can come into the market buying volume on the dips, when prices fall.
Zinc and lead struggling
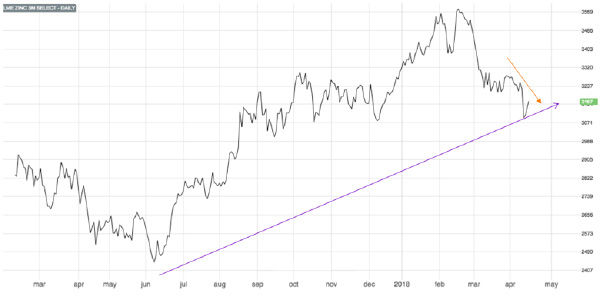
Meanwhile, LME zinc and lead prices traded more sideways this month. LME zinc prices have remained in a long-term uptrend since the beginning of 2016, and currently trade at a slower pace within a short-term downtrend. LME zinc prices have returned to December 2017 levels ($3,160/mt) well off their peak of $3,588/mt.

Source: MetalMiner analysis of FastMarkets, LME Zinc 3-month price, March 2017-April 2018.
However, this price retracement may not result in a long-term downtrend as the commodities and base metals complex remain in an uptrend. Therefore, buying organizations will want to identify the buying dips to secure their purchases and reduce risks.
Commodities and the US dollar
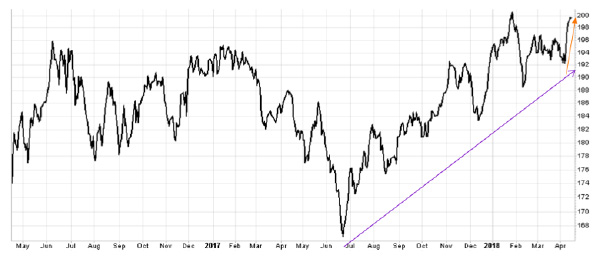
The CRB index continues its long-term uptrend. During the first half of April, the CRB index increased sharply. Higher crude oil prices, together with a weaker US dollar have supported the CRB index.

Source: MetalMiner analysis of StockCharts, CRB Index, March 2017-April 2018.
by Irene Martinez Canorea
