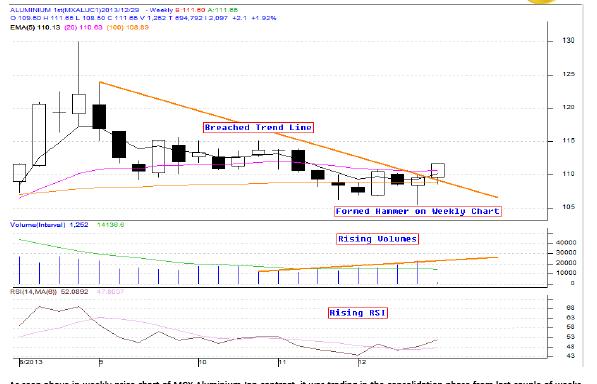
As seen above in weekly price chart of MCX Aluminium Jan contract, it was trading in the consolidation phase from last couple of weeks. Last week we saw that prices have formed a Bullish candle stick pattern namely “Hammer” on support level. During the same period prices made a low of 105.40, high of 109.90 and closed near high levels of 109.55 levels. As per the trend we also observed that prices have breached the “Down Trend Line” coupled with substantial volumes which is a sign of optimism.
Indicator Analysis
Prices are trading above its 5, 20 and 100 week EMA (Exponential Moving Average) along with rising volumes will be supportive for the prices. On the oscillator front, 14 week RSI is rising from the oversold zone and its currently reading at 52 which indicates optimism.
Key Levels
Resistance could be seen at 117 levels and then final resistance is observed at 120 levels. Price can find support at level of 110 levels and below that strong support is seen at level of 107 levels.
Looking at positive price formation with rising volumes coupled with oscillators indicating optimism, we recommend Buy in MCX Aluminium Jan contract.
Positional Call (5- 6 Days) - Buy MCX Aluminium Jan between 110.80 – 111.40, SL - 107, Target – 117 / 120. according to Angel Commodities.