There's virgin space on our charts is the place in impulse, with no overlaps. This space could serve as a support-resistance level or a target for a next high degree wave. This usually arises in the third wave of the third wave – the middle of the middle.
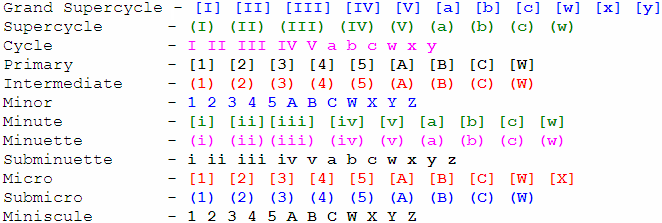
Let us consider US dollar position against all major currencies. 2017 year has brought unstoppable dollar weakness. The USD value in FOREX market decreases and decreases with no end in sight, the more and more people talk about a new time for US dollar, trying to bind together dollar weakness, different political events and economical processes. In recent weeks amount of US dollar pessimists has surged to a yearly high. We just leave those people with their talks alone and take a look at the root reason of US dollar movement – crowd behavior, to measure crowd behavior we take Elliott waves.
EUR/USD spot
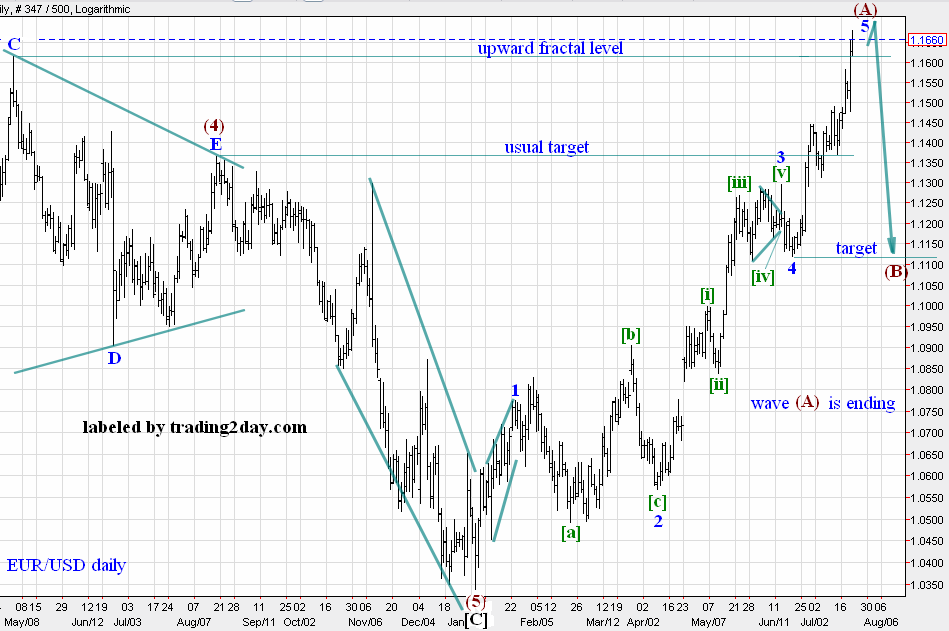
Wave (A) end. You may count waves with another way and get a wave 3 end. Waves count does not matter now. A large move up is near its end, rise has retraced previous ending triangle, all BUYs are not reliable anymore, EUR/USD is topping and reversing down.
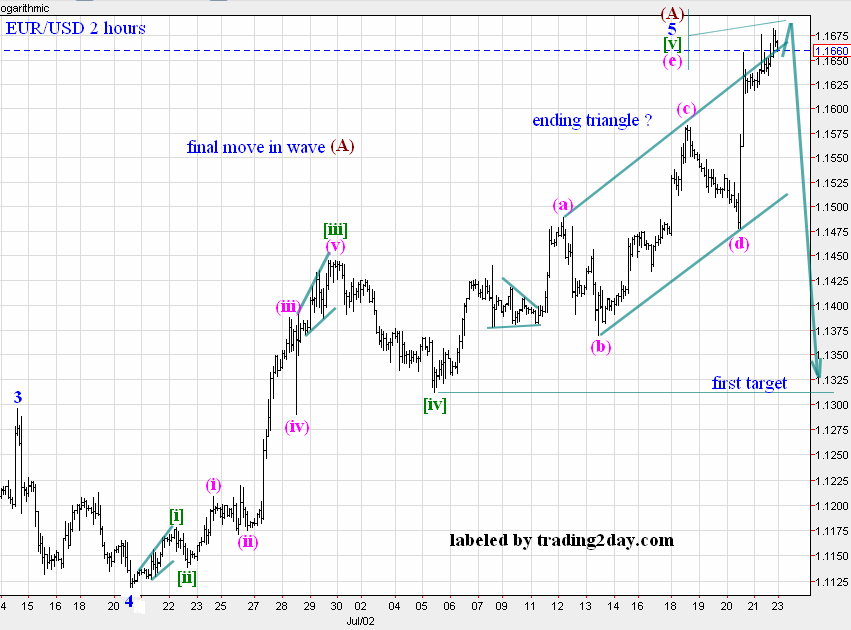
Possible ending triangle as the last upward move. The euro is out of steam to climb higher.
USD/CHF spot
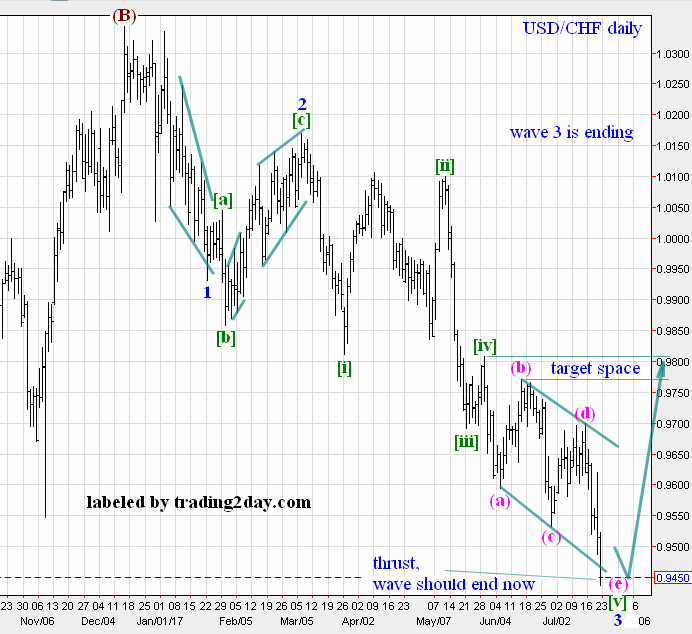
Wave (3) end. Or you may count with your desirable way, you will get the end of downward move anyway. It is not wise to keep any SELL now.
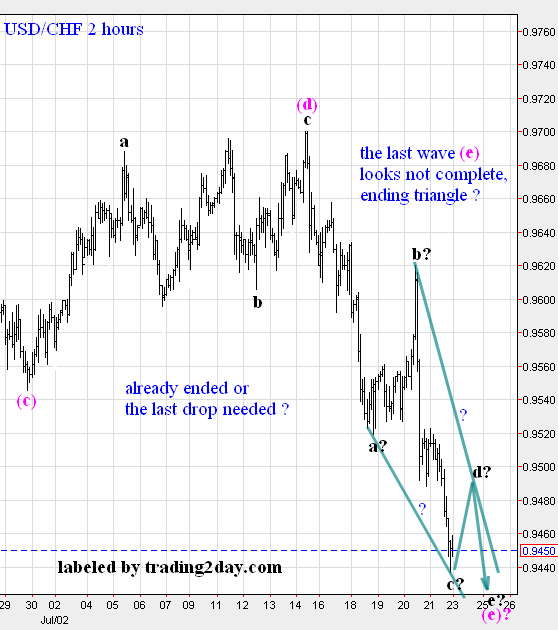
Close look at the final wave in ending triangle. One more short thrust down is possible, but we do not care much, we do not keep any frank’s SELL now and just wait for frank to reverse. After reverse we shall correct our present count if needed.
GBP/USD spot
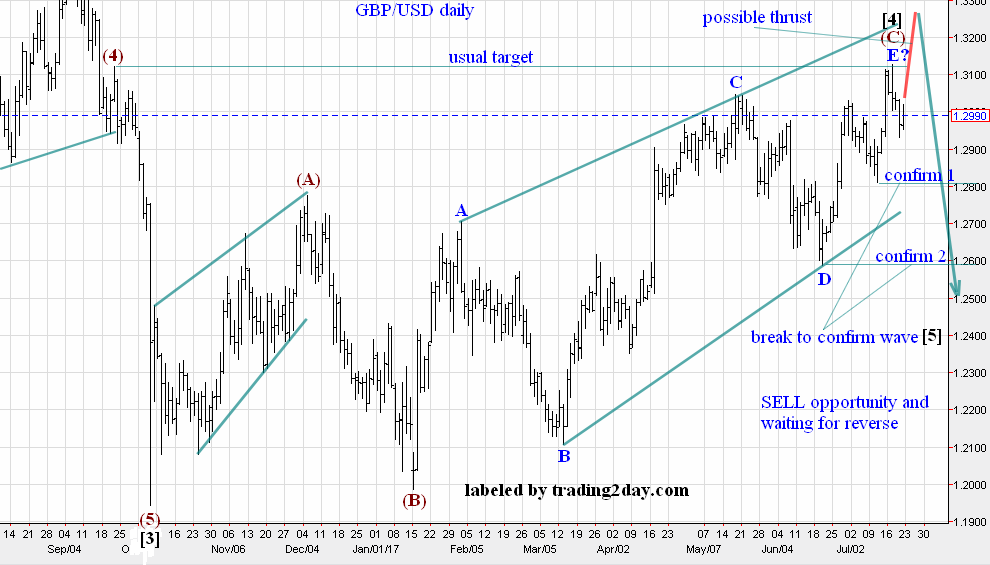
Current situation and SELL opportunity setup has been described in our previous article
GBP/USD
We have established a long term SELL position from the recent top. Price has retreated since then, but situation still looks good to SELL pound against US dollar. We still await possible ending thrust toward the upper triangle line, marked with red, but with every calm day its possibility decreases and decreases. Anyway, trading account with newly opened SELL position should have enough money leeway to endure possible red thrust up. Read how to calculate a short position in our previous GBP/USD article.
We would have more confidence in wave [5] move, if price falls below our confirmation levels. Breakup of the lowest level (wave D bottom) is a decisive sign of wave [5] run.
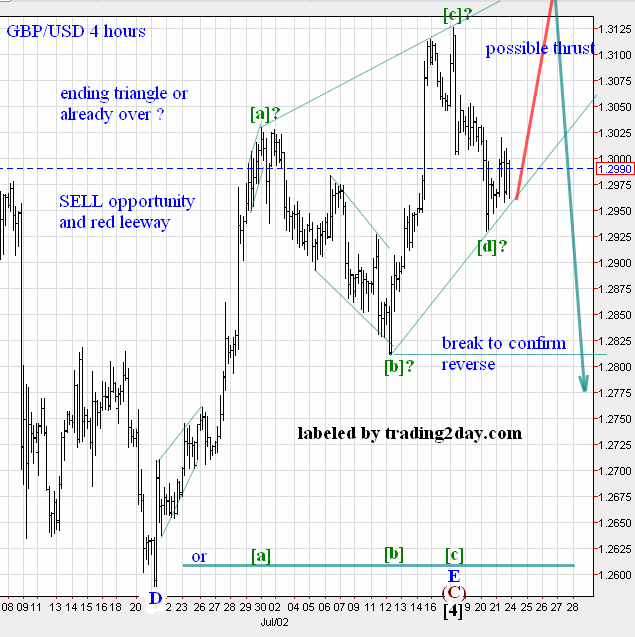
Chart above shows our thoughts – wave E maybe already over or red thrust would unfold, in this case wave E would be an ending triangle.
USD/SEK, Swedish krona spot
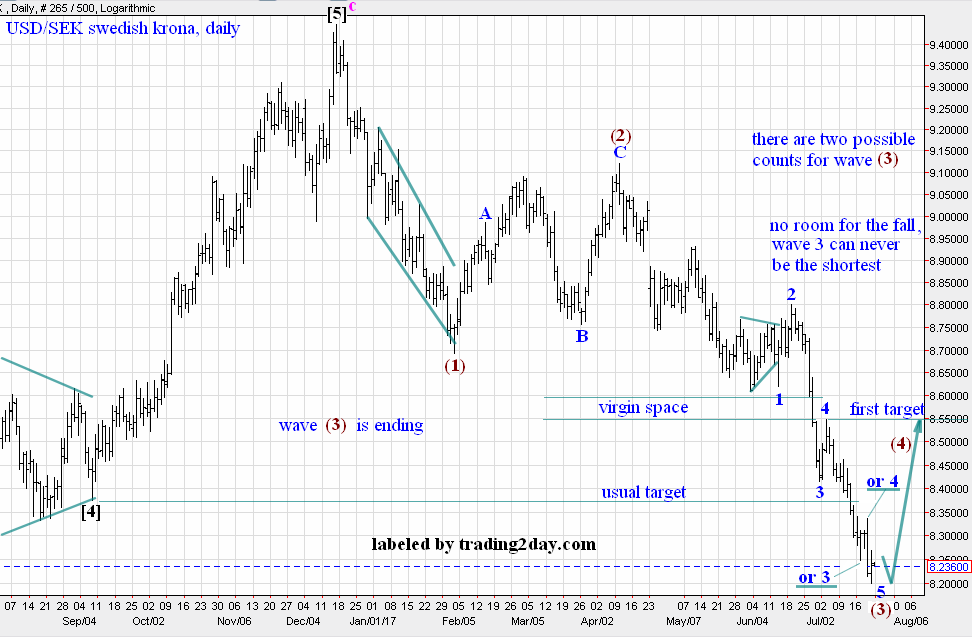
Waves look similar enough to US Dollar Index and give the similar result – the main move down is ending. Wave (3) has a pretty complex first wave and not obvious fourth wave. It is not clear where the final part of wave (3) is. The most reliable variant is marked on the chart above directly. If our assumptions are right, then krona is reversing right now. If price would fall further, then wave 3 bottom is lower, than we think now, and we would get the same result – move down is ending, SELLs are out of fashion.
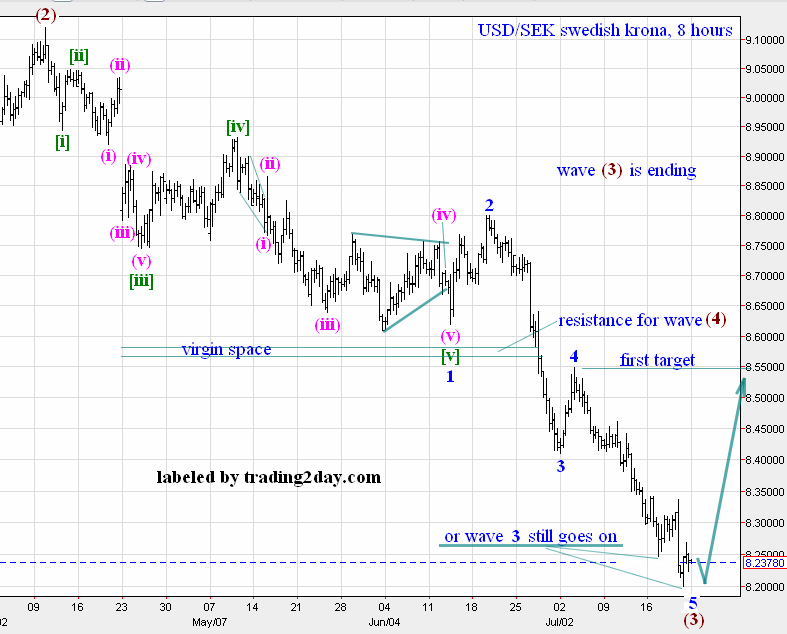
More close look at wave (3). Compare with USD/CHF, EUR/USD and US dollar index. This is Morningstar (old Tenfore) chart, MetaTrader4 chart has no overlaps in wave 1.
Current swap rate for long positions on USD/SEK gives up to 13 points per every day. Some BUY to ride on awaited wave (4) could be an interesting decision for a free capital.
USD/CAD spot
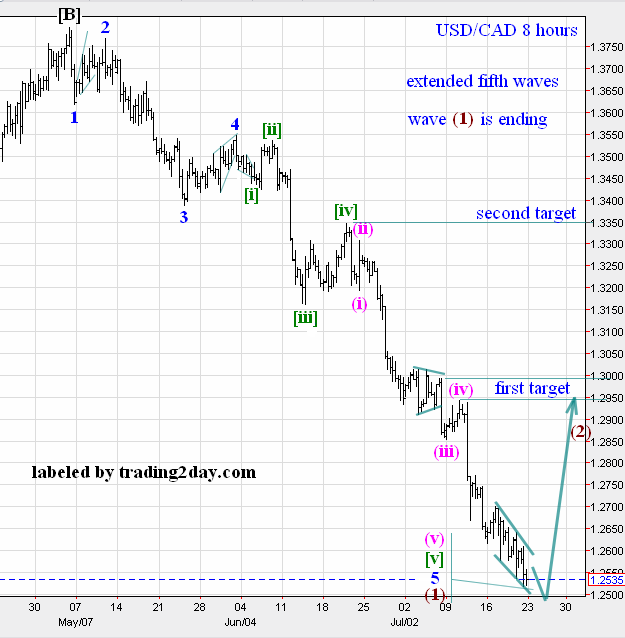
Despite of a deep fall we do think, that this is a single wave, just its fifth wave is extended, and the fifth wave in the fifth wave is also extended. Some kind of ending triangle is unfolding in the very end of the move. No SELLs here, a deep fall can produce a high pull-back to the nearest fractals in extended fifth wave. Close SELLs, wait for a high correction and count waves – the best tactics now.
US dollar Index
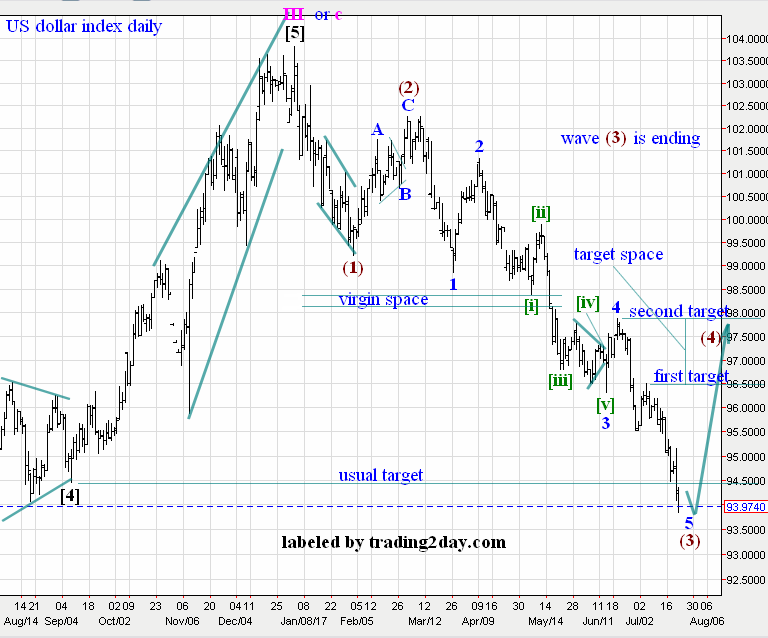
Index has more clear impulsive wave (3), than krona has, and more obvious ending wave in wave (3). Perhaps, wave (3) is near its end. Again, some kind of an ending triangle can be seen at the very end of the move. Reverse is coming, nearest upward fractals are the nearest targets for upcoming wave (4).
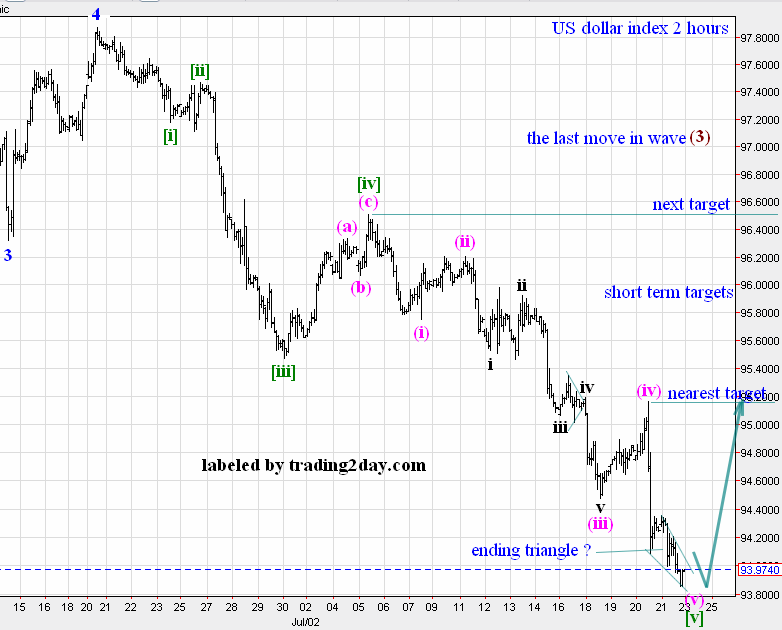
Chart above – final move down on US Dollar Index.
A defenseless US dollar is going to snap every seller.
Disclosure: None of the information or opinions expressed in this blog constitutes a solicitation for the purchase or sale of any security or other instrument. Nothing in this article constitutes investment advice and any recommendations that June be contained herein have not been based upon a consideration of the investment objectives, financial situation or particular needs of any specific recipient. Any purchase or sale activity in any securities or other instrument should be based upon your own analysis and conclusions.
All my market opinions reflect my own trading behavior, this behavior is based on Elliott waves law. Any my opinion cannot be considered as an investment advice and may or may not match with market opinions of other trading2day.com authors.
by Artyom Chefranov
