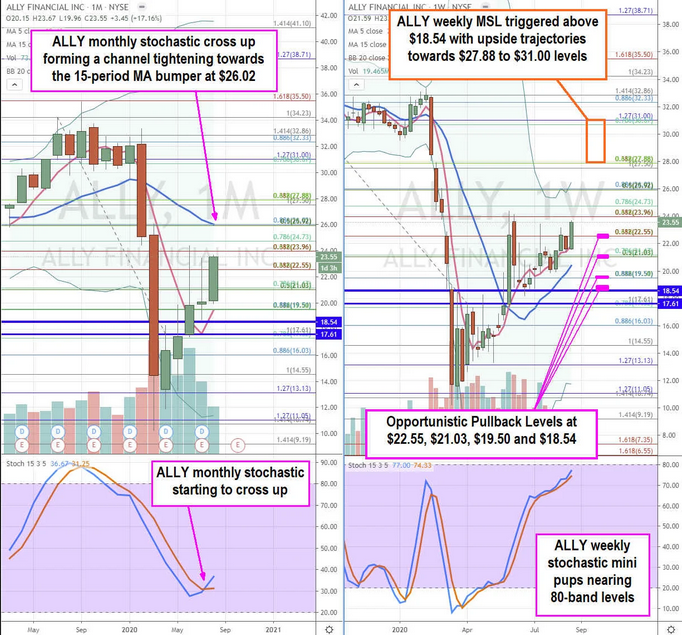
Digital financial products and services fintech company Ally Financial (NYSE:ALLY) shares have been on a tear outperforming traditional bank stocks as it nears its pre-COVID levels. This financial company was originally an auto financing spin-off formerly GMAC but has since transformed into a nimble innovative fintech utilizing data analytics and automation to better accommodate the tech-savvy Gen-X, Millennials and Gen-Z app-based end-user. With a heavy emphasis on social impact and social media marketing, the Company has taken a non-traditional path to differentiate its brand as user-friendly and socially conscious. The Company has expanded services beyond auto loans to include banking services, mortgages, wealth management and trading platform. Shares are rising with the benchmark SPDR S&P 500 (NYSE:SPY) and making for lofty entries. Rather than chasing, it’s prudent to watch for opportunistic pullback levels for good entries.
Q2 FY 2020 Earnings Release
On July 17, 2020, Ally released its second-quarter fiscal 2020 results for the quarter ending June 2020. The Company reported earnings-per-share (EPS) of $0.61 versus consensus analyst estimates for a profit of $0.26, a $0.35 per share beat. Revenues grew 3.7% year-over-year (YoY) to $1.61 billion beating consensus estimates of $1.47 billion. Credit loss provisions were boosted to $287 million, up $110 YoY to address pandemic effects. Ally Bank retail deposits grew 17% YoY to $115.8 billion from 2.1 million retail deposit customers, up 14% YoY. Ally Bank was also voted Kiplinger’s Best Internet Bank for the fourth consecutive year. Ally Invest self-directed accounts grew 15% YoY to 388 thousand accounts. Ally home mortgage originations were the highest quarter since 2016 at $1.2 billion. Ally lending was the strongest quarter at $75 million as the Company entered the home improvement financing space. Auto financing pre-tax income was $329 million, down (-$130 million) YoY due to COVID-19 loss provisions. During the quarter, industry-wide vehicle inventory levels fell (-33%) YoY to lowest level in a decade directly impacted COVID-19 triggered factory closures. The Company ended the quarter with $18.6 billion in liquidity.
The Network Effect
The fintech multiplier value proposition of offering existing customers to new services is the future of Ally Financial. Ally Bank has grown into one of the largest direct retail deposit platforms. Record retail customer deposits were driven by factors including stimulus checks, extended 2019 tax filing deadlines, competitive interest rates, promotions and the network effect introducing existing customers to the multiple service offerings. Between the months of Mark through June, Ally Invest saw trading levels and account balances simultaneously gain momentum as trading activity reached the highest levels since acquired in 2016. Stay-at-home mandates have naturally drawn more investors into the world of trading as evidenced by the explosive growth in zero-commission trading app Robinhood. Ally Invest is also a zero-commission trading app seeing momentum from small investors.
The Zero-Commission Trading App Rage
Fintech investing trading apps like Robinhood, WeBull, and Sofi has gained global recognition but have yet to trade publicly. With such strong financial market momentum and surge in trading activity, Ally shares can be a direct benefactor of this trend in self-directed investing. If investors can’t get a piece of Robinhood, they may choose Ally shares for now. As outlined in an early article, the advent of zero-commission trading is no doubt a major catalyst causing retail investors to participate in stock markets, again. As restart narrative continues with rebounds expected in consumer spending and borrowing, auto-recovery, home improvement and purchasing and stock market volatility, ALLY should continue its upside trajectories. With the SPY reaching new all-time highs, the momentum and volatility in the markets is here to stay. This is a boon to ALLY shares, but the stock itself needs a pullback for better value opportunities at these levels.

ALLY Opportunistic Pullback Price Levels
Using the rifle charts on the monthly and weekly time frames provides a broader view of the landscape for ALLY stock. The monthly rifle chart stochastic is starting to cross up forming a channel tightening towards the monthly 15-period moving average (MA) with a rising 5-period MA at the $19.50 Fibonacci (fib) level. The weekly rifle chart already triggered a market structure low (MSL) buy above $18.54. The weekly stochastic has been in a bullish stairstep mini pup as it approaches the overbought 80-band. This is where a deflection and opportunistic pullback price levels may present itself at the $22.55 fib, $21.03 fib, $19.50 monthly 5-period MA/fib and $18.54 weekly MSL trigger. The current momentum may push shares up towards the monthly 15-period MA at $26.02 before pullbacks set in back to the weekly 5-period MA. Ultimately, a breakout through the monthly 15-period MA targets upside trajectory range between $27.88 and $31.00 fib levels. Shares may also spike on any news of a Robinhood, WeBull or Sofi S-1 initial public offering (IPO).
