In January I launched an “All-Weather ETF Portfolio”. The portfolio began with a static allocation based on a simplistic and unleveraged interpretation of Ray Dalio and Bridgwater Associates “All-Weather” investment strategy. The proposed static allocation is below: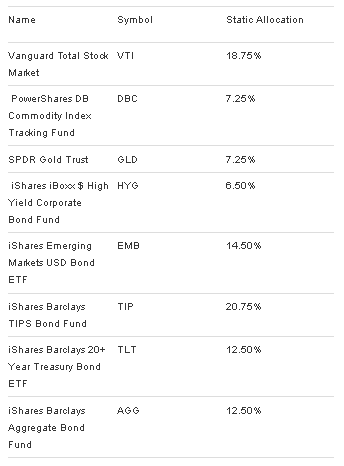
The proposed allocation is not intended as a one-size-fits-all allocation model, but it does serve as a framework for further study and is based on having allocation to the four different market environments espoused by Bridgewater (full paper here):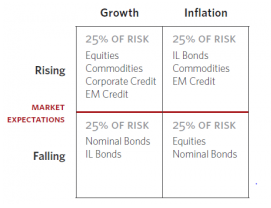
I backtested the static allocation using ETFReplay.com - it outperformed the Vanguard 60-40 (VBINX) mutual fund since 2008 on both a total and risk-adjusted basis. The All-Weather portfolio has a sharpe ratio of .67 and max drawdown of -21.5% versus a sharpe of.25 and max drawdown of -34.4% for VBINX. Positions were rebalanced annually: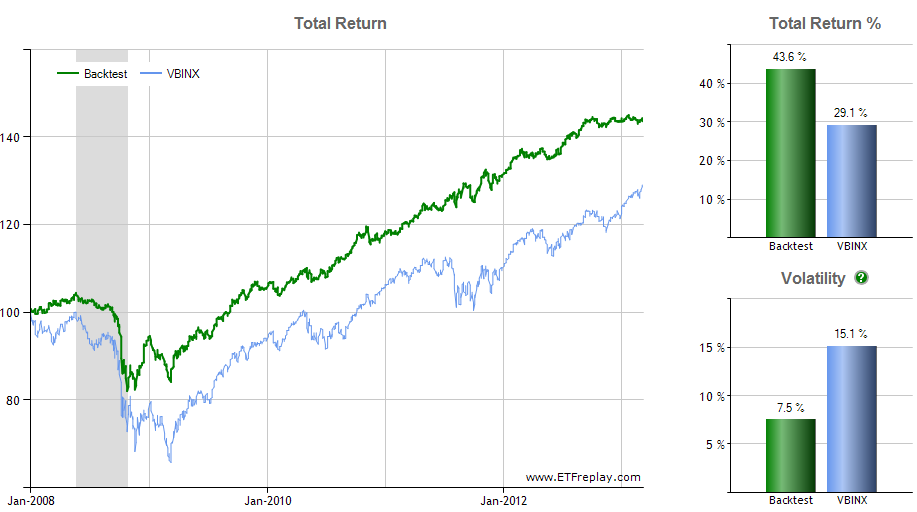
Last week I introduced a basic risk-parity allocation tool for the All-Weather ETF portfolio. The risk parity allocation uses the trailing 20-day volatility of the adjusted closing prices of each ETF to calculate a risk-based allocation. The risk parity allocation as of Friday’s close is below: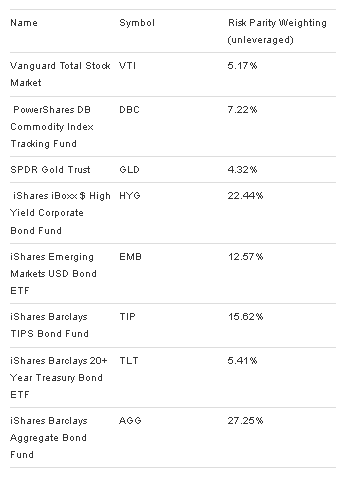
The All-Weather ETF portfolio risk-parity allocation has performed relatively well since 2008, also outperforming VBINX by a wide margin. Risk-parity posted a sharpe ratio of .82 and max drawdown of -16.8%. Positions were rebalanced quarterly: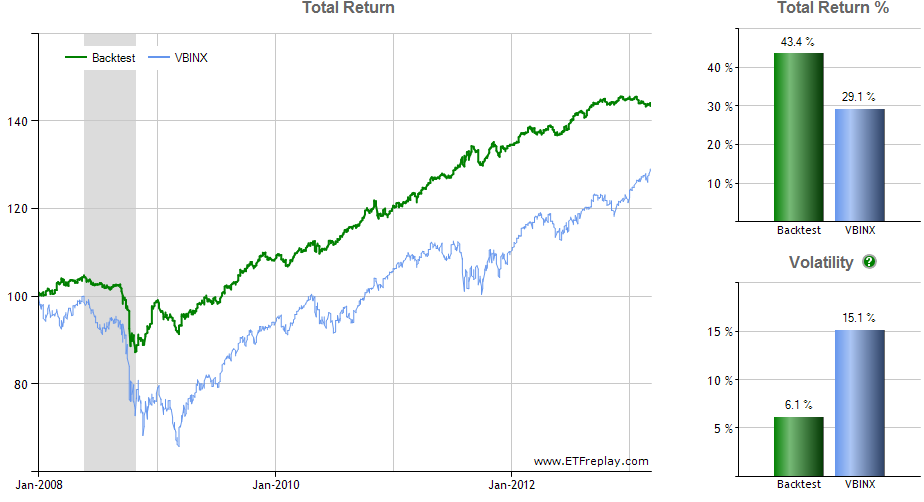
When researching the All-Weather portfolio I came across David Varadi’s work at CSS Analytics. Varadi, along with Michael Kapler, Corey Rittenhouse, and Henry Bee, published a paper in September 2012, “The Minimum Correlation Algorithm: A Practical Diversification Tool”. In the paper they introduce two heuristic algorithms for effective portfolio diversification and passive investment management, which they conclude “is an excellent alternative to Risk Parity, Minimum Variance and Maximum Diversification.”
Their algorithm, in my own words, is an alternative asset allocation model which makes intuitive sense. It uses both the historical volatility and correlation of securities in a portfolio to determine asset allocation. Securities with low correlations and volatility relative to the other securities in the portfolio receive higher weightings. The result is a portfolio allocation which changes over time to reflect the evolving volatility and correlations of the securities in the portfolio.
I was happily surprised to discover David freely provides a downloadable “Mincorr spreadsheet” on his site. The spreadsheet uses the algorithms presented in the paper and allows users to calculate their own minimum correlation allocations.
50 Top Stocks
After downloading the spreadsheet from CSS Analytics, I tweaked it to incorporate eight securities (this took a little more time than anticipated). I then created a template to download daily price data to calculate trailing correlations and volatility for the eight securities in the All-Weather portfolio (this took a lot more time than anticipated). Finally, I used the Mincorr spreadsheet framework to calculate a daily “minimum correlation” allocation for the eight securities in the All-Weather ETF portfolio and I provide the results on the All-Weather ETF spreadsheet.
Backtesting this strategy is more difficult than a simple risk-parity or static asset allocation model. The most comprehensive tests are available in the The Minimum Correlation Algorithm paper, which has tests dating to 1980 for a variety of portfolios. The authors of the paper were kind enough to help me run some tests for the All-Weather ETF portfolio. The tests are available in the pdf here: minn corr backtests, with tests being run from December 2007 – February 2013. The “min.corr.excel” results used a formula close to the calculation on my All-Weather spreadsheet.
The current Minimum Correlation allocations are below: 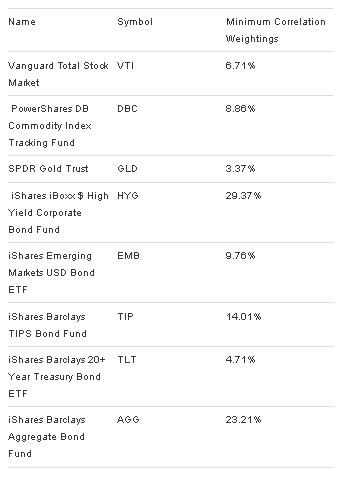
Note: my minimum correlation formula differs slightly from the method in the The Minimum Correlation Algorithm in that I use a 20-day historical volatility & correlation versus the 60-day range used in the paper. Using a shorter time period allows the spreadsheet to load quicker, but I may change the 20-day look-back period in the future.
Any errors or omissions in my Min Corr calculation are my own. I have done my best to review and scrub the data, but I make no warranties. As my programming knowledge evolves I hope to post additional minimum correlation backtests.
Past performance is no guarantee of future results. To learn more about the Minimum Correlation algorithm please take a few minutes to visit CSS Analytics.
If you enjoy these free tools, please consider making a donation on the home page of Scott’s Investments using the Paypal link in the upper-right corner!
Disclaimer: Stock Loon LLC, Scott's Investments and its author is not a financial adviser. Stock Loon LLC, Scott's Investments and its author does not offer recommendations or personal investment advice to any specific person for any particular purpose. Please consult your own investment adviser and do your own due diligence before making any investment decisions. Please read the full disclaimer at the bottom of www.scottsinvestments.com
- English (UK)
- English (India)
- English (Canada)
- English (Australia)
- English (South Africa)
- English (Philippines)
- English (Nigeria)
- Deutsch
- Español (España)
- Español (México)
- Français
- Italiano
- Nederlands
- Português (Portugal)
- Polski
- Português (Brasil)
- Русский
- Türkçe
- العربية
- Ελληνικά
- Svenska
- Suomi
- עברית
- 日本語
- 한국어
- 简体中文
- 繁體中文
- Bahasa Indonesia
- Bahasa Melayu
- ไทย
- Tiếng Việt
- हिंदी
All-Weather ETF Portfolio: Minimum Correlation Allocation
Published 03/11/2013, 05:05 AM
Updated 07/09/2023, 06:31 AM
All-Weather ETF Portfolio: Minimum Correlation Allocation
Latest comments
Loading next article…
Install Our App
Risk Disclosure: Trading in financial instruments and/or cryptocurrencies involves high risks including the risk of losing some, or all, of your investment amount, and may not be suitable for all investors. Prices of cryptocurrencies are extremely volatile and may be affected by external factors such as financial, regulatory or political events. Trading on margin increases the financial risks.
Before deciding to trade in financial instrument or cryptocurrencies you should be fully informed of the risks and costs associated with trading the financial markets, carefully consider your investment objectives, level of experience, and risk appetite, and seek professional advice where needed.
Fusion Media would like to remind you that the data contained in this website is not necessarily real-time nor accurate. The data and prices on the website are not necessarily provided by any market or exchange, but may be provided by market makers, and so prices may not be accurate and may differ from the actual price at any given market, meaning prices are indicative and not appropriate for trading purposes. Fusion Media and any provider of the data contained in this website will not accept liability for any loss or damage as a result of your trading, or your reliance on the information contained within this website.
It is prohibited to use, store, reproduce, display, modify, transmit or distribute the data contained in this website without the explicit prior written permission of Fusion Media and/or the data provider. All intellectual property rights are reserved by the providers and/or the exchange providing the data contained in this website.
Fusion Media may be compensated by the advertisers that appear on the website, based on your interaction with the advertisements or advertisers.
© 2007-2025 - Fusion Media Limited. All Rights Reserved.
