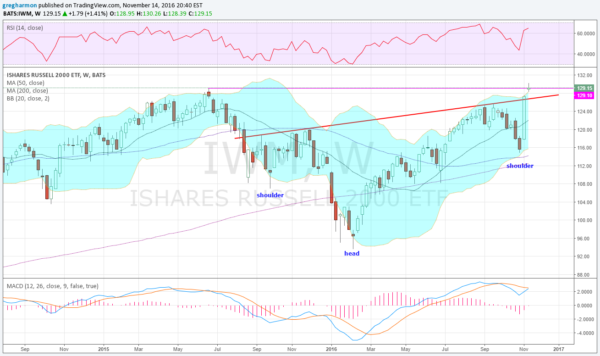
After an unprecedented 10% move higher last week, the iShares Russell 2000 (NYSE:IWM) gapped higher Monday and ran to a new intraday all-time high over 130. It could not hold there and fell back through the day, but managed to close at a new all-time closing higher. It was the last of the major index ETF’s to get there, passing its June 2015 high. And the prospects look good for more upside.
There are at least 4 features in the chart below that help explain why. The first is an Inverse Head and Shoulders pattern. This one has a rising neckline and it broke above it at the end of last week. This gives a price objective to at least 154.50. It does not have to move there quickly or in a straight line. And the pattern would be invalidated by a move back under the October low at 114.88.

There is also the MACD at the bottom of the chart that is about to cross up. This in itself is a bullish signal, and with the RSI in the bullish zone and rising it has added weight. The Bollinger Bands® are also turned higher and opening to allow a move up. Finally, and most importantly, is the price itself.
Some will see a doji and suggest it means a reversal coming. But doji’s mean indecision. In this case indecision as it hits a new all-time high should not be unexpected. But the trend is higher, not just over the last two weeks, but since February. It needs to be broken to the downside to a new low before the uptrend is invalidated.
The information in this blog post represents my own opinions and does not contain a recommendation for any particular security or investment. I or my affiliates may hold positions or other interests in securities mentioned in the Blog, please see my Disclaimer page for my full disclaimer.
