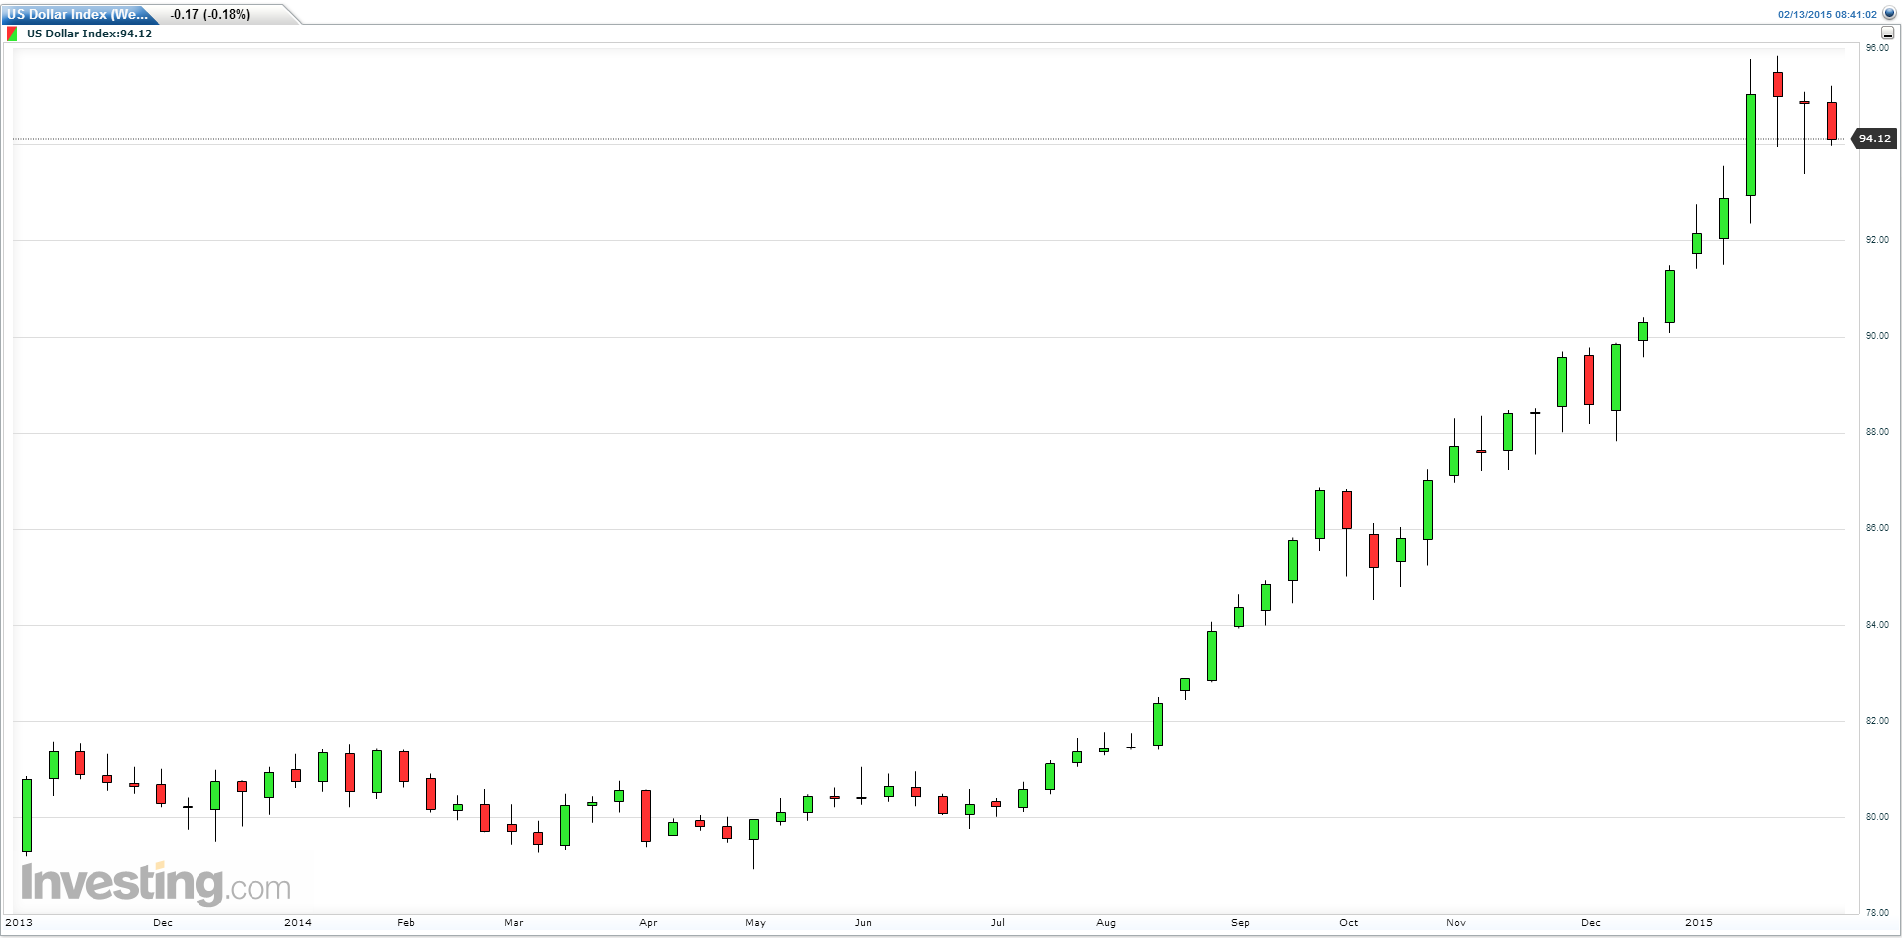
As forex traders it is often too easy to forget that even the strongest trends come to an end, or pause in their longer term journey, and at such times, it is also easy to simply continue taking positions in the same way, with hardly a glance at the chart. The dollar index is a classic example.
We have all become used to the daily and weekly revival for the US dollar, since it first awakened from its slumbers in mid 2014, to sustain a meteoric and almost vertical rise, with each day and week building further bullish momentum. But as always in the markets, nothing lasts forever. And with many forex traders now caught in short positions, particularly in the majors, the current bullish trend has paused and stalled, with the weekly chart sending a clear and unequivocal signal of weakness ahead for the currency of first reserve with the hanging man candle of last week. Such a candle is a classic sign of exhaustion and a possible reversal.
The logic behind this candle is simple. During the week, sellers entered the market driving the price lower, but there were still sufficient buyers to absorb this selling pressure, taking the market back to close near the open, and as a consequence forming the classical ‘hanging man’ candle. The primary characteristic of this candle is a deep lower wick and narrow body.
However, what is important here is not the buying which supported the market, but the selling, which suggests a change in sentiment is on the horizon. It is the first clear signal that the bulls are exhausted and the bears are just beginning to enter the market. Whilst they failed on this occasion to drive the market lower, nevertheless, it is the first sign of a significant shift in sentiment.
Even more so, when viewed against the previous candle, which also demonstrated a degree of selling pressure with the extended lower wick to the body of the candle and closing as a down candle. So far this week, this shift in sentiment has been reflected with a move lower for the dollar index which is currently trading at 94.14 at the time of writing. Given the signals now appearing in this time frame it will be no surprise to see a period of congestion at this level with further signals of weakness, and the possibility of an extended reversal in due course.
The fundamental picture is broadly supportive as markets now appear to be anticipating a slightly less bullish tone from the FOMC in the coming months. Moreover, with other major economies sliding ever deeper into recession and outright depression, with inflation targets failing to be met, the bullish drivers for the US dollar have been withering too. This has been reflected in a recovery for the euro (written off once again) and for the British pound, with other major pairs now sending strong technical reversal signals in the longer term time frames.
