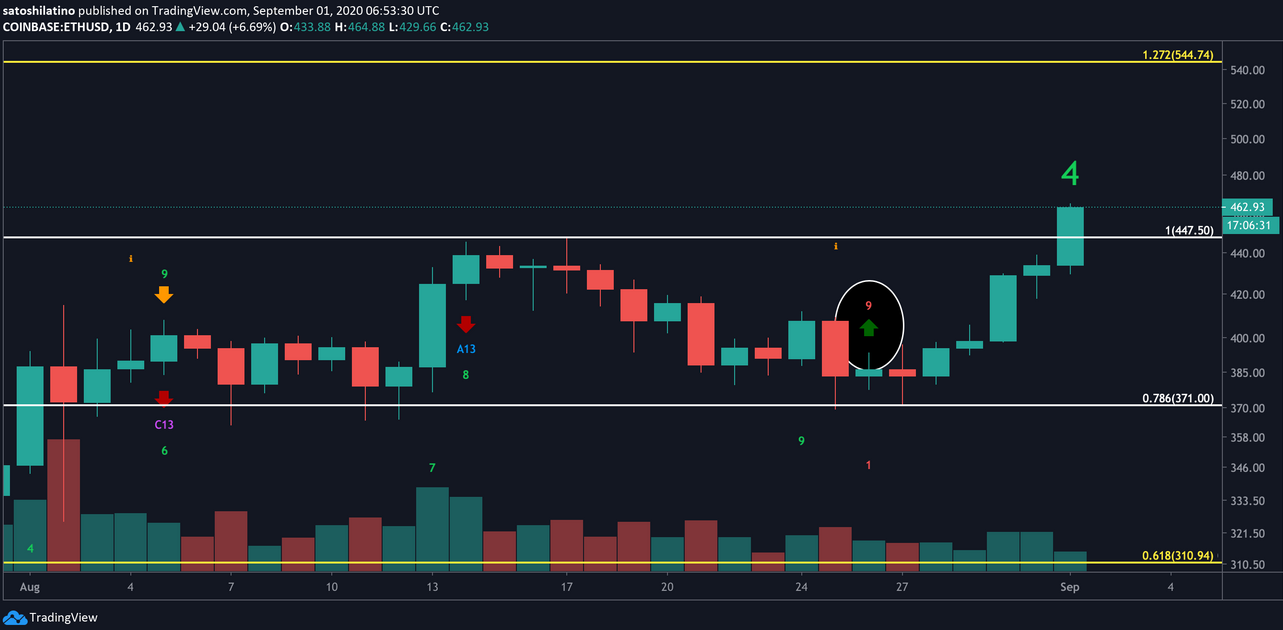
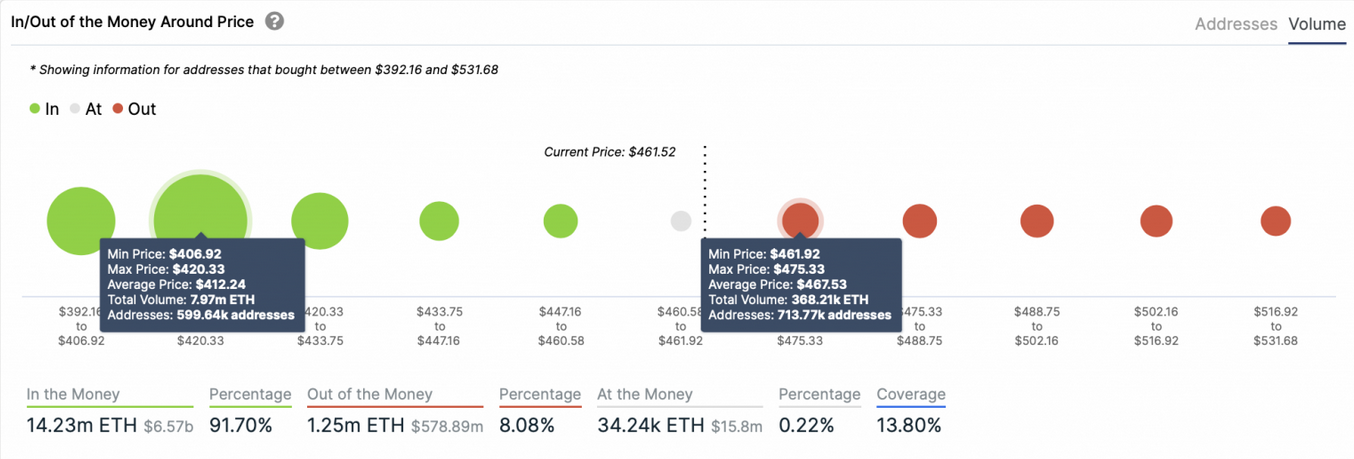
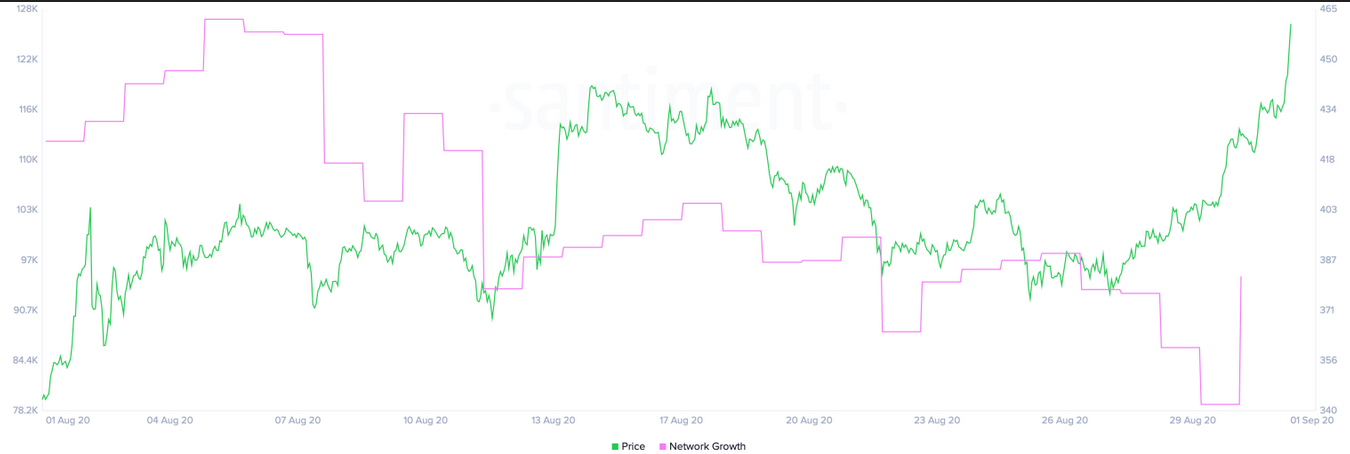
Ethereum is breaking out and even though prices seem to have taken a breather, ETH appears to have more gas in the tank. Ethereum has stolen the crypto spotlight again after surging to new yearly highs. Now, different metrics suggest ETH isn’t done just yet. Since the beginning of the month, Ethereum has been consolidating within a narrow range. The smart contracts giant had been mostly contained between the $447 resistance barrier and the 78.6% Fibonacci retracement level, without providing any clear signals of where it was headed next. Although the TD sequential index had presented a buy signal on August 26, it was uncertain whether or not it was going to be validated. A spike in the buying pressure behind Ether that began to build up right around support seems to have confirmed the bullish formation. As a result, it led a 25% bull rally over the past week that has seen ETH break above resistance and make a new yearly high of $467. Now, Ethereum seems poised for a further advance towards 127.2% Fibonacci retracement level. IntoTheBlock’s “In/Out of the Money Around Price” (IOMAP) model reveals there is no supply barrier that will prevent the second-largest cryptocurrency by market cap from achieving its upside potential. Based on this on-chain metric, there is only one major area of interest between $462 and $475 that is filled by a high number of investors that had previously purchased Ether around this price level. Here, roughly 715,000 addresses are holding nearly 370,000 ETH. This area may have the ability to absorb some of the buying pressure seen recently. Holders who have been underwater may try to break even on their positions, slowing down the uptrend. But if Ether can slice through this hurdle, it would likely climb to $545. On the flip side, the IOMAP cohorts show that Ether sits on top of stable support. Nearly 600,000 addresses bought roughly 8 million ETH between $407 and $420. This crucial area of interest suggests that bears will struggle to push prices down. Right now, the odds favor the bulls. It is worth noting that following the recent bullish impulse, the Ethereum network also began to expand. Data from the behavior analytics firm Santiment indicates that the number of new addresses being created daily surged alongside prices. The recent spike in Ether’s network growth can be considered a positive signal that supports the overall uptrend. Based on historical data, network growth is regarded as one of the leading on-chain price indicators. An increase in user adoption over time can help observers understand the health and well being of a cryptocurrency network. Usually, a prolonged upswing in network growth leads to a price increase. The addition of newly-created addresses also tends to positively impact the regular inflow and outflow of tokens in the network, so traders beware.Key Takeaways
Ethereum Makes New Yearly Highs


On-Chain Metrics Bullish

- English (UK)
- English (India)
- English (Canada)
- English (Australia)
- English (South Africa)
- English (Philippines)
- English (Nigeria)
- Deutsch
- Español (España)
- Español (México)
- Français
- Italiano
- Nederlands
- Português (Portugal)
- Polski
- Português (Brasil)
- Русский
- Türkçe
- العربية
- Ελληνικά
- Svenska
- Suomi
- עברית
- 日本語
- 한국어
- 简体中文
- 繁體中文
- Bahasa Indonesia
- Bahasa Melayu
- ไทย
- Tiếng Việt
- हिंदी
All Eyes On Ethereum As ETH Makes New Yearly Highs, Aiming For $550
Published 09/01/2020, 04:56 AM
All Eyes On Ethereum As ETH Makes New Yearly Highs, Aiming For $550
Latest comments
Loading next article…
Install Our App
Risk Disclosure: Trading in financial instruments and/or cryptocurrencies involves high risks including the risk of losing some, or all, of your investment amount, and may not be suitable for all investors. Prices of cryptocurrencies are extremely volatile and may be affected by external factors such as financial, regulatory or political events. Trading on margin increases the financial risks.
Before deciding to trade in financial instrument or cryptocurrencies you should be fully informed of the risks and costs associated with trading the financial markets, carefully consider your investment objectives, level of experience, and risk appetite, and seek professional advice where needed.
Fusion Media would like to remind you that the data contained in this website is not necessarily real-time nor accurate. The data and prices on the website are not necessarily provided by any market or exchange, but may be provided by market makers, and so prices may not be accurate and may differ from the actual price at any given market, meaning prices are indicative and not appropriate for trading purposes. Fusion Media and any provider of the data contained in this website will not accept liability for any loss or damage as a result of your trading, or your reliance on the information contained within this website.
It is prohibited to use, store, reproduce, display, modify, transmit or distribute the data contained in this website without the explicit prior written permission of Fusion Media and/or the data provider. All intellectual property rights are reserved by the providers and/or the exchange providing the data contained in this website.
Fusion Media may be compensated by the advertisers that appear on the website, based on your interaction with the advertisements or advertisers.
© 2007-2025 - Fusion Media Limited. All Rights Reserved.
