Alibaba (NYSE:BABA) Group Holding Limited (NYSE: BABA) is a Chinese e-commerce company that provides sales services via web portals. It also provides electronic payment services, a shopping search engine and data-centric cloud computing services. Alibaba is one of the largest Internet companies as its online sales & profits surpassed all US retailers (including Walmart (NYSE:WMT), Amazon (NASDAQ:AMZN) and eBay Inc (NASDAQ:EBAY)) combined in 2015 and it now considered as the world’s largest retailer surpassing Walmart.
Alibaba Shares recently managed to make new all time highs after breaking above 2014 peak $120 and investors are still looking for more gains to come. Let’s jump into the Elliott Wave technical analysis to see how bullish is it ?
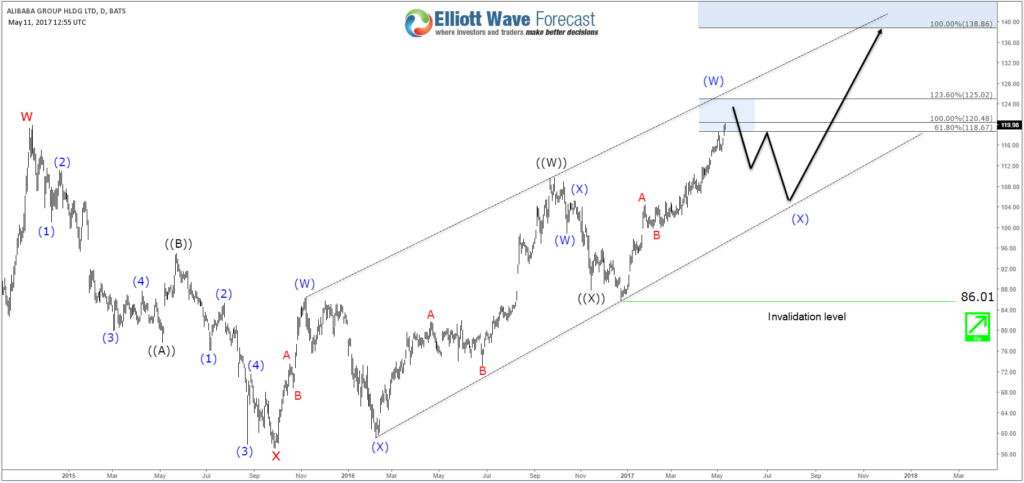
BABA Double Three Structure
Since 2015 low, BABA started trading in 3 waves move to the upside which currently is forming 5 swings sequence with divergence which we consider as an incomplete bullish sequence as part of a double three structure. So according to the swing structure , the stock is ending the 5th swing around equal legs area $120 – $125 from December 2016 low and it should then pullback in 3 waves against 86.01 low. The 6th swing pullback should ideally hold above the bullish channel to be able to resume the rally toward equal legs area $138 from September 2015.

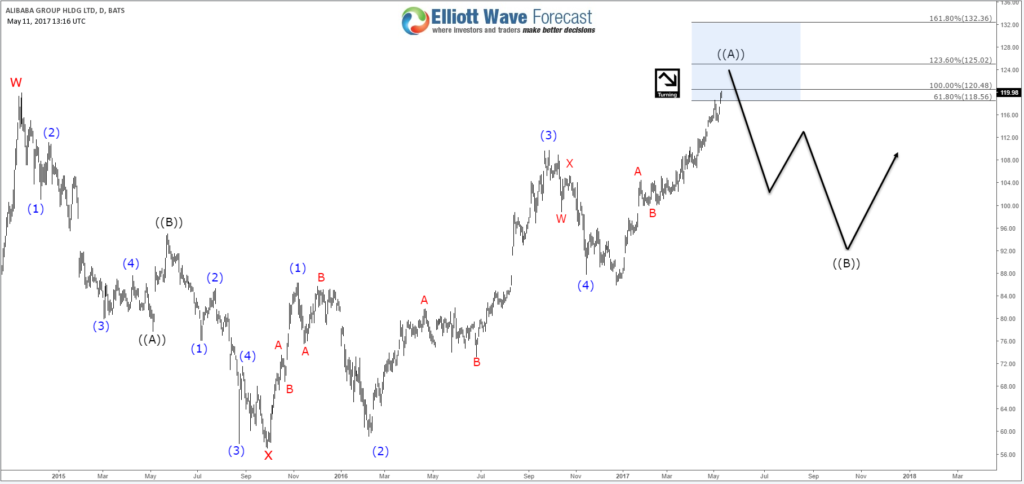
BABA Leading Diagonal Structure
The second scenario for BABA would be represented when the pivot at $86.01 low gives up later on, which will mean the stock has ended the cycle from from September 2015 low and in that case it can be counted as a leading diagonal because it has 5 corrective waves holding the divergence. Consequently , the correction can extend toward $90 area and take longer time before the stock resume the move to the upside.

Recap:
Alibaba Shares ( BABA ) has a daily bullish structure suggesting more upside in the future. However currently the stock has reached the extreme area $120 – $125 from December 2016 low so no matter which scenario will play out there will be a 3 waves pullback before buyers starts showing up again. Depending on the speed & structure of the correction we’ll know exactly which cycle has ended and where & when will be the ideal area to look for buying opportunities.
