Apartment Investment and Management Company (NYSE:AIV) — better known as Aimco — reported second-quarter 2017 pro forma funds from operations (“FFO”) of 61 cents per share, beating the Zacks Consensus Estimate by a cent. The figure also represents a 3.4% increase from the year-ago quarter tally of 59 cents.
Results display growth in same-store property net operating income (NOI) and increased contribution from development, redevelopment and acquisition communities. Lesser general and administrative costs, lower interest expense and other expenses also contributed to higher funds from operations. However, the positive was partially offset by the loss of income from apartment sales in 2016, reduced earnings from exiting the Asset Management business and lower tax benefits.
Total revenue of $249.1 million outpaced the Zacks Consensus Estimate of $241.37 million. In addition, the reported figure came in higher than the prior-year quarter tally of $251.2 million.
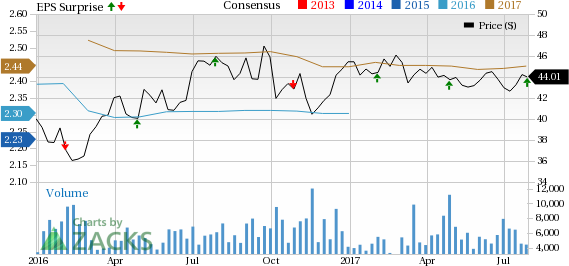
Apartment Investment and Management Company Price, Consensus and EPS Surprise
Note: The EPS numbers presented in the above chart represent funds from operations (FFO) per share.
Quarter in Detail
Same-store revenues increased 3.4% year over year to $145.9 million, while expenses edged down 0.3% year over year to $41.7 million. Consequently, same-store net operating income (NOI) climbed 4.9% to $104.2 million on a year-over-year basis.
However, same-store average daily occupancy contracted 1 basis point year over year to 95.9%. Rental rates on renewals contracted 50 basis points (bps) from the expiring lease rates compared to the previous quarter. Rents on new lease improved to 1% from a 1% decline witnessed in the previous quarter.
As of Jun 30, 2017, Aimco held cash and restricted cash on hand of $49.1 million. Moreover, the estimated fair market value of the company’s unencumbered apartment communities came in at $1.8 billion.
Further, at the end of the quarter, Aimco’s outstanding borrowings on its revolving credit facility were $246 million and available capacity was $343 million, after considering $11 million of letters of credit backed by the facility.
Portfolio Activity
During the quarter, Aimco invested $47 million in redevelopment and development. The company increased its revenue per apartment home by 7% to $2,038. Additionally, it enhanced the quality and expected growth rate of its portfolio. Specifically, the percentage of A, B and C+ home came in at 53%, 33% and 14% in second-quarter 2017 compared with 50%, 37% and 13% , recorded respectively in the year-ago quarter.
Guidance
For third-quarter 2017, Aimco provided pro forma FFO per share guidance in the band of 60–64. The Zacks Consensus Estimate for the same is 61 cents.
Dividend
On Jul 26, Aimco announced a quarterly cash dividend of 36 cents per share of Class A Common Stock for second-quarter 2017. This marks a 9% year-over-year increase. The dividend will be paid on Aug 31 to stockholders of record as of Aug 18, 2017.
Bottom Line
Aimco has a solid portfolio, diversified in terms of geography and price point. Furthermore, the company has been revamping its portfolio through property sales and reinvesting the proceeds in select apartment homes with higher rents, superior margins and greater-than-expected growth. Its efforts to reduce costs resulted in significant growth in Same Store NOI.
Other than improvement in Same Store NOI, Aimco’s new construction and redevelopment activities also contributed to its bottom line.
However, of late, Aimco has been witnessing sluggish rent growth in certain locations due to competition from new supply. The company’s elaborate construction project plans, along with planned capital replacement spending, remain key concerns. Moreover, even if the divestitures and its exit from the Asset Management business pay off in the long run, the company’s near-term adverse effects on earnings cannot be bypassed.
Aimco currently carries a Zacks Rank #3 (Hold). You can see the complete list of today’s Zacks #1 Rank (Strong Buy) stocks here.
The stock has lost 3.2% year to date, as against 4.8% growth recorded by the industry it belongs to.

We now look forward to the earnings releases of other REITs like Boston Properties, Inc. (NYSE:BXP) , AvalonBay Communities, Inc. (NYSE:AVB) and Condor Hospitality Trust, Inc. (NYSE:CDOR) . Boston Properties and AvalonBay Communities are scheduled to announce results on Aug 1 and Aug 2. Condor Hospitality Trust is slated to release quarterly numbers on Aug 7.
Note: FFO, a widely used metric to gauge the performance of REITs, is obtained after adding depreciation and amortization and other non-cash expenses to net income.
The Hottest Tech Mega-Trend of All
Last year, it generated $8 billion in global revenues. By 2020, it's predicted to blast through the roof to $47 billion. Famed investor Mark Cuban says it will produce "the world's second trillionaires," but that should still leave plenty of money for regular investors who make the right trades early.
See Zacks' 3 Best Stocks to Play This Trend >>
Apartment Investment and Management Company (AIV): Free Stock Analysis Report
AvalonBay Communities, Inc. (AVB): Free Stock Analysis Report
Boston Properties, Inc. (BXP): Free Stock Analysis Report
Condor Hospitality Trust, Inc. (CDOR): Free Stock Analysis Report
Original post

