
Agenus Inc. (NASDAQ:AGEN) incurred second-quarter 2017 loss of 32 cents per share, narrower than the Zacks Consensus Estimate of a loss of 36 cents and the year-ago loss of 33 cents.
Revenues were $4.2 million and missed the Zacks Consensus Estimate of $6 million. Also, the top line was down from $6.6 million in the year-ago quarter.
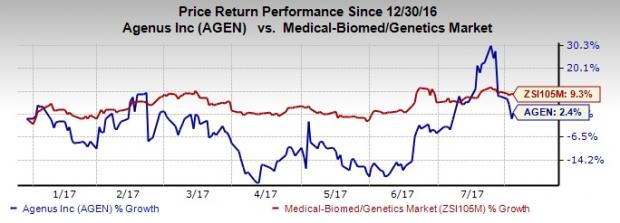
Notably, Agenus’ share price increased 2.4% year to date compared with the Zacks classified industry’s gain of 9.3%.
Quarterly Highlights
Agenus' second-quarter research and development (R&D) expenses were up 15.5% to $25.8 million. General and administrative expenses were also up 14.3% to $8.1 million.
Pipeline Update
Agenus is progressing well with various candidates in its pipeline. Currently, the company is evaluating AGEN1884 in a phase I study. It reported early safety and efficacy data on AGEN1884 at the ASCO conference in 2017. In fact, the company expects to complete the study in 2017.
Also, GlaxoSmithKline (NYSE:GSK) filed for regulatory approval of Shingrix vaccine, which contains Agenus' QS-21 Stimulon. In fact, GSK’s shingles has been filed for regulatory approval in the US, Canada, the EU and also in Japan. A decision is expected in the second half of this year.
Agenus Inc. Price, Consensus and EPS Surprise
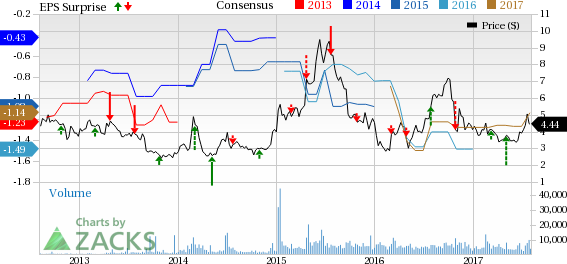
Agenus Inc. Price, Consensus and EPS Surprise | Agenus Inc. Quote
Zacks Rank & Stocks to Consider
Agenus currently carries a Zacks Rank #2 (Hold). Other top ranked pharma stocks in the same space include Exelixis, Inc. (NASDAQ:EXEL) and Enzo Biochem, Inc. (NYSE:ENZ) sporting a Zacks Rank #2 (Buy). You can see the complete list of today’s Zacks #1 Rank (Strong Buy) stocks here
Exelixis’ pulled off positive earnings surprises in all the trailing four quarters, with an average beat of 543.59%. The share price of the company has increased 72.4% year to date.
Enzo Biochem’s loss per share estimates narrowed from 12 cents to 7 cents for 2017 and from 11 cents to 3 cents for 2018, over the last 60 days. The company delivered positive earnings surprises in all the trailing four quarters, with an average beat of 55.83%. The share price of the company has increased 60.9% year to date.
Today's Stocks from Zacks' Hottest Strategies
It's hard to believe, even for us at Zacks. But while the market gained +18.8% from 2016 - Q1 2017, our top stock-picking screens have returned +157.0%, +128.0%, +97.8%, +94.7%, and +90.2% respectively. And this outperformance has not just been a recent phenomenon. Over the years it has been remarkably consistent. From 2000 - Q1 2017, the composite yearly average gain for these strategies has beaten the market more than 11X over. Maybe even more remarkable is the fact that we're willing to share their latest stocks with you without cost or obligation. See Them Free>>
GlaxoSmithKline PLC (GSK): Free Stock Analysis Report
Enzo Biochem, Inc. (ENZ): Free Stock Analysis Report
Exelixis, Inc. (EXEL): Free Stock Analysis Report
Agenus Inc. (AGEN): Free Stock Analysis Report
Original post
Zacks Investment Research