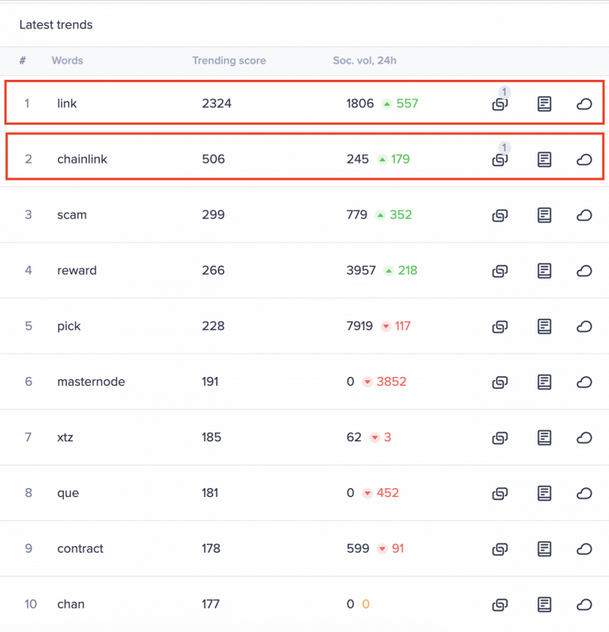
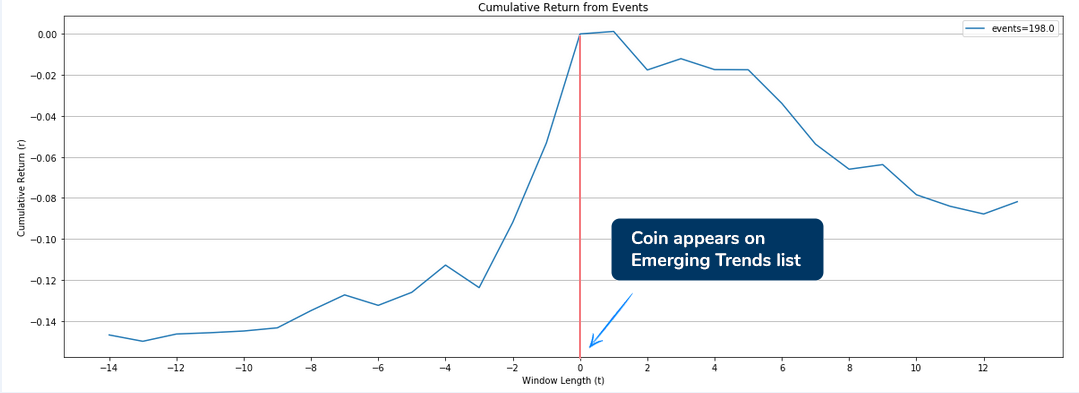
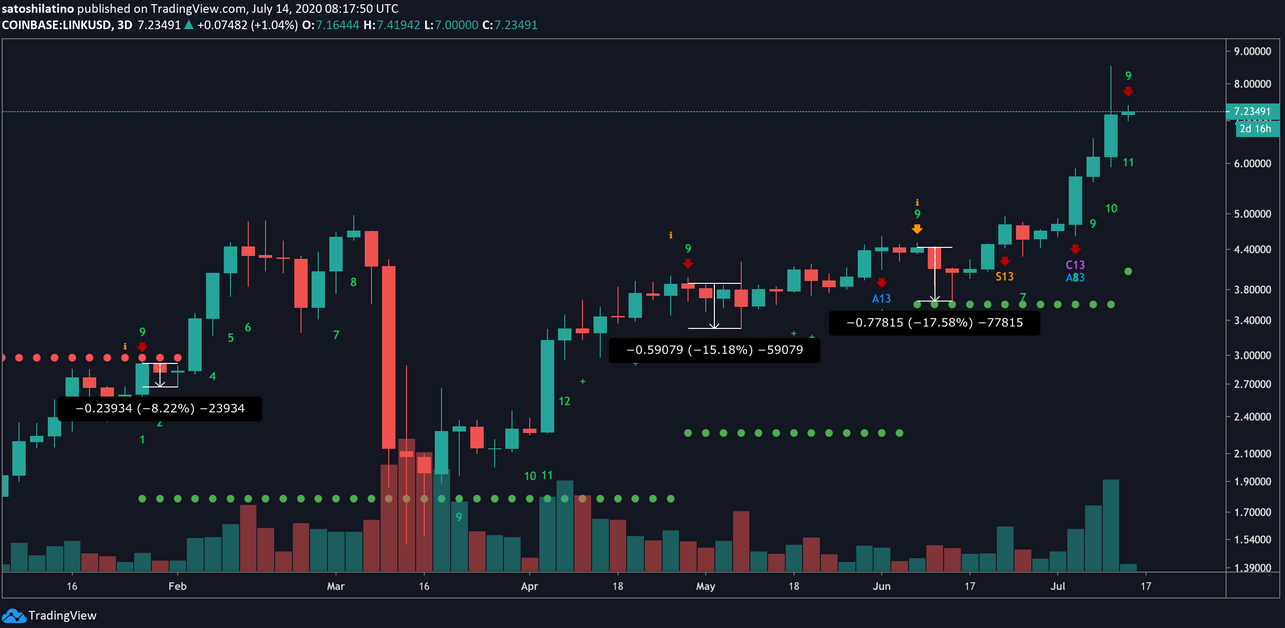
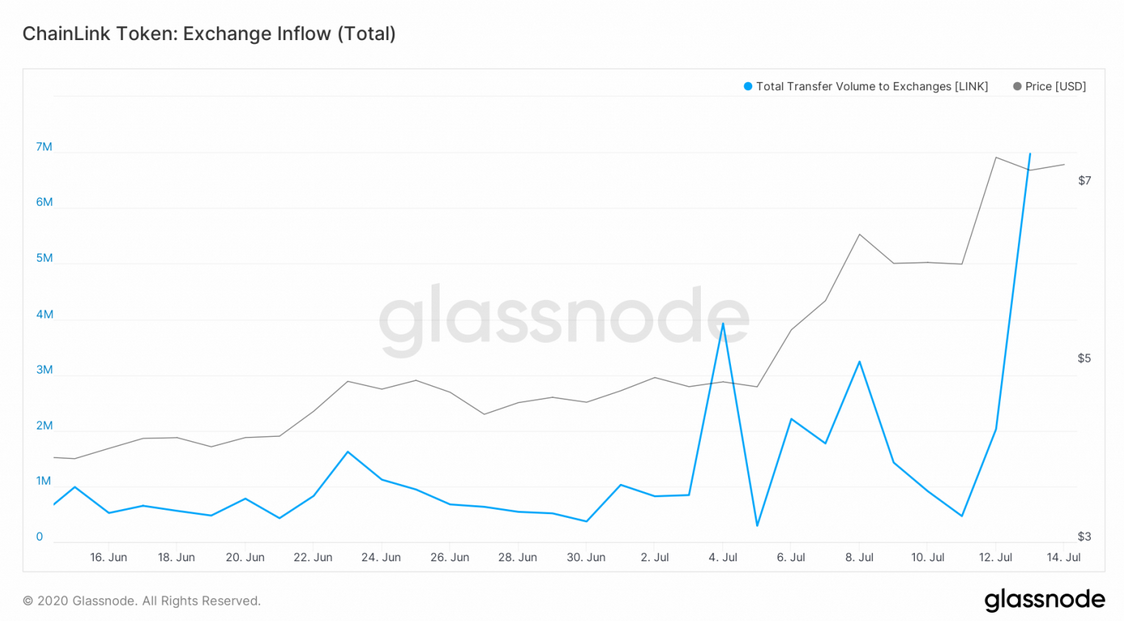
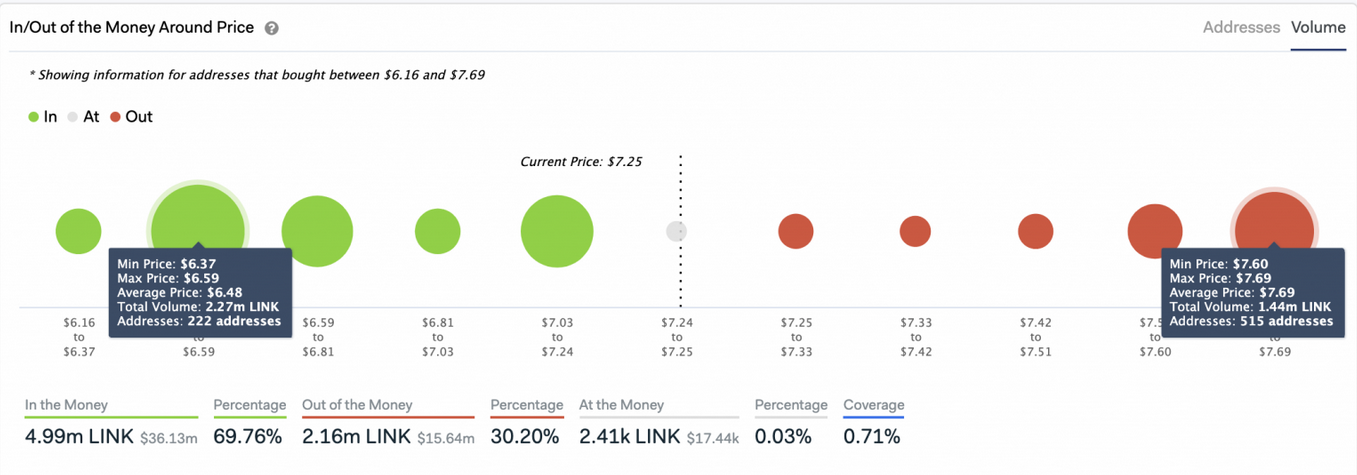
The decentralized oracles token, Chainlink, made headlines this week after rising to new all-time highs. Now, it looks like LINK is in for a correction. After reaching new all-time highs, Chainlink’s native LINK token recently suffered a significant pullback. Now, according to different metrics, the mooning token looks like it will continue dropping. Chainlink stole the crypto spotlight after surging to new all-time highs on Monday. Once the decentralized oracles token entered price discovery mode on July 5, the buying pressure behind it skyrocketed. Data reveals that nearly $1 billion were injected into this cryptocurrency. The massive buying pressure behind it led to a 72% upswing in a matter of seven days. Chainlink went from breaking above early March’s high of nearly $5 to hit a record high of $8.5. LINK’s meteoric price action did not go unnoticed, either. The number of Chainlink-related mentions on social media increased as investors entered a state of FOMO. The rising chatter around this cryptocurrency allowed it to move to the top of Santiment’s Emerging Trends list, which is a historically negative sign. Dino Ibisbegovic, head of content and SEO at Santiment, maintains that when the crowd pays increased attention to a given cryptocurrency because of an ongoing pump, it is usually followed by a pullback. “Within the next 12 days after a coin claims a top 3 position on our list of Emerging Trends, its price drops by an average of 8.2 percent. Based on our study, once the increased crowd attention subsides (which usually happens in a matter of hours/days), a short-term price correction – or consolidation – is often a likely outcome,” said Ibisbegovic. Indeed, Chainlink reached an exhaustion point after investors became overwhelmingly bullish about LINK’s price action. This altcoin took a 19.8% nosedive over the past few hours to hit a low of $6.85, but it managed to bounce back above $7. Now, the TD sequential index estimates that there are more losses to come. This technical indicator is currently presenting a sell signal in the form of a green nine candlestick on LINK’s 3-day chart. The bearish formation forecasts a one to four candlestick correction before the continuation of the uptrend. Given the TD setup’s accuracy to time local tops on Chainlink’s trend, the current sell signal must be taken seriously despite the losses already incurred. When looking at activity across top cryptocurrency exchanges, this thesis holds. Glassnode, an on-chain data and intelligence platform, reveals that nearly $7 million worth of LINK tokens have been transferred to different exchanges over the last 24 hours. The considerable spike in the number of tokens transferred to exchanges can be considered a sign of mounting selling pressure behind LINK. IntoTheBlock’s “In/Out of the Money Around Price” (IOMAP) shows that the $6.5 support level may have the ability to hold in the event of a sell-off. Roughly 222 addresses had previously purchased over 2.27 million LINK around this price level. This critical supply wall could prevent Chainlink from a steeper decline since holders within this price range will try to remain profitable. They may even buy more LINK to avoid seeing their investments go into the red. It is worth remembering that Chainlink is currently in price discovery mode, so the probability of a further advance cannot be taken out of the question. If buy orders begin to pile up, this cryptocurrency may rise towards the next significant resistance barrier sitting at $7.7. Here, the IOMAP cohorts indicate that 515 addresses bought over 1,400 LINK. Moving past this hurdle could send Chainlink to re-test the recent high of $8.5 or make new all-time highs.Key Takeaways
Chainlink Rises to New All-Time Highs
A Steep Correction Ahead
- English (UK)
- English (India)
- English (Canada)
- English (Australia)
- English (South Africa)
- English (Philippines)
- English (Nigeria)
- Deutsch
- Español (España)
- Español (México)
- Français
- Italiano
- Nederlands
- Polski
- Português (Portugal)
- Português (Brasil)
- Русский
- Türkçe
- العربية
- Ελληνικά
- Svenska
- Suomi
- עברית
- 日本語
- 한국어
- 简体中文
- 繁體中文
- Bahasa Indonesia
- Bahasa Melayu
- ไทย
- Tiếng Việt
- हिंदी
After Reaching All-Time Highs, Chainlink Poised For Fresh Losses
Published 07/14/2020, 08:26 AM
After Reaching All-Time Highs, Chainlink Poised For Fresh Losses
Latest comments
Loading next article…
Install Our App
Risk Disclosure: Trading in financial instruments and/or cryptocurrencies involves high risks including the risk of losing some, or all, of your investment amount, and may not be suitable for all investors. Prices of cryptocurrencies are extremely volatile and may be affected by external factors such as financial, regulatory or political events. Trading on margin increases the financial risks.
Before deciding to trade in financial instrument or cryptocurrencies you should be fully informed of the risks and costs associated with trading the financial markets, carefully consider your investment objectives, level of experience, and risk appetite, and seek professional advice where needed.
Fusion Media would like to remind you that the data contained in this website is not necessarily real-time nor accurate. The data and prices on the website are not necessarily provided by any market or exchange, but may be provided by market makers, and so prices may not be accurate and may differ from the actual price at any given market, meaning prices are indicative and not appropriate for trading purposes. Fusion Media and any provider of the data contained in this website will not accept liability for any loss or damage as a result of your trading, or your reliance on the information contained within this website.
It is prohibited to use, store, reproduce, display, modify, transmit or distribute the data contained in this website without the explicit prior written permission of Fusion Media and/or the data provider. All intellectual property rights are reserved by the providers and/or the exchange providing the data contained in this website.
Fusion Media may be compensated by the advertisers that appear on the website, based on your interaction with the advertisements or advertisers.
© 2007-2025 - Fusion Media Limited. All Rights Reserved.
