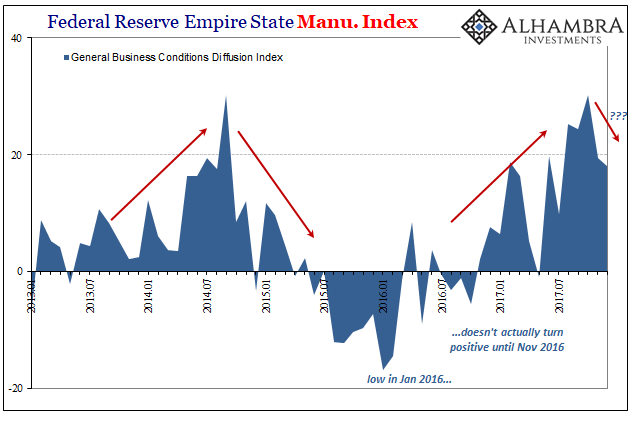
The Federal Reserve’s Empire State Manufacturing Index fell slightly in its December 2017 estimate. At +18, that’s down from 19.4 in November and a high of +30.2 in October. It’s also nowhere near the low for the year, a -1.0 recorded back in May.
This particular PMI is potentially noteworthy for what appears to be a replicating cycle. In a statistical coincidence, that peak in October matches exactly the one estimated for September 2014 (also +30.2) just prior to the economic drag provided by the “rising dollar.” It may just be that manufacturing, or at least what’s going on in New York State, has registered a temporary pause before busting the cycle pattern. Or perhaps it truly is closer to a replay.
It’s impossible to tell just by the Empire Fed index, noisy and prone to severe monthly swings. There are other signs, however, as similar survey-based figures like Markit’s PMI’s are suggesting a possible softening trend, too.
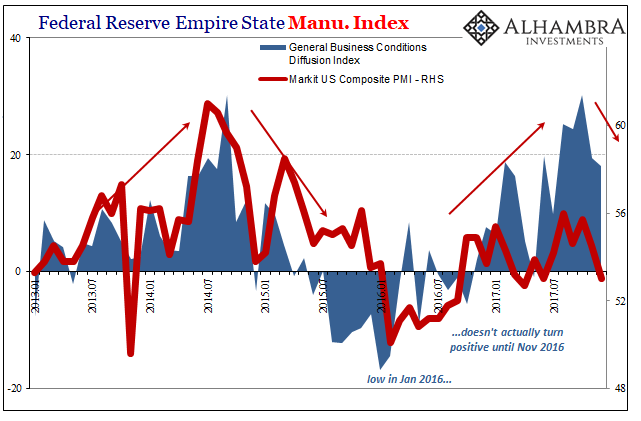
The lower value for the composite is due to Markit’s Services PMI which hit a 15-month low in December. As you can plainly see above, there is a noticeable difference in sentiment – in manufacturing it is far greater, supposedly, than perhaps in the rest of the economy. Like the Empire Fed, Markit’s Manufacturing PMI suggests continued good sentiment in that sector.
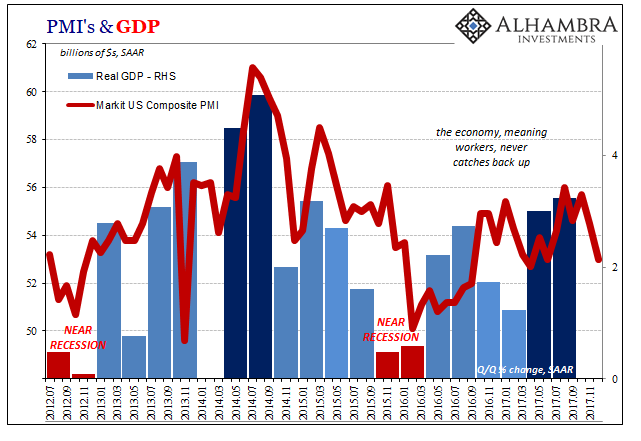
The problem, such that there is one, is that the composite PMI has a much better track record of correlation with the major statistics like GDP. What stands out to me is not what this index might be suggesting or even predicting about Q4 2017 in concert with the Empire Fed’s variety, but more importantly that like GDP it is indicating a much-reduced peak to this upturn than the last one in 2014. Those two middle quarters three years ago in terms of GDP reached 4.5% and 5.0%, compared to just 3.0% and 3.2% this year.
The composite PMI during the big quarter (Q3 2014) hit a robust (seeming) 61 back then, but only 56 at its most recent high in August. If the direction of the index since then is accurate or even close, then it is telling us again that there is much less momentum on this upswing than experienced in the more potent if ultimately insufficient one back then.
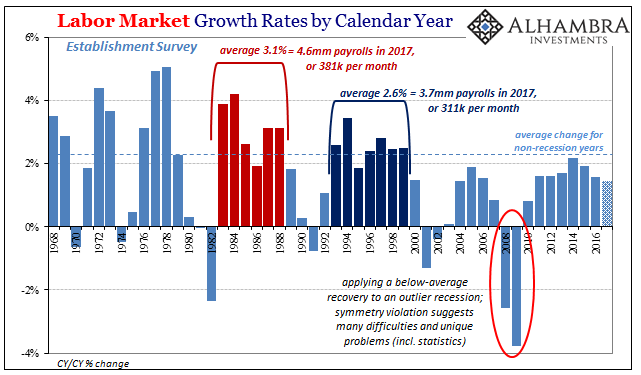
It would appear to be consistent with labor market indications that aren’t very good, obscured by what’s reported to be such positive sentiment especially in manufacturing (ISM, too). Instead, an economy heading into 2018 possibly maxed out at just 3% GDP growth and perhaps already waning from there doesn’t set up next year for anything good. If 2017 is failed “reflation”, what does that hint at for 2018?
