LEARNING FROM HISTORICAL MARKET FACTS
When investors are concerned about future economic outcomes, they often migrate toward more defensive-oriented long-term U.S. Treasury bonds (NASDAQ:TLT). The recent surge in demand for defensive bonds caused an extremely rare and extended look on the monthly, weekly, and daily charts of TLT. TLT closed above the upper Bollinger® Band on all three charts (monthly. weekly, daily) on May 31, 2019. Therefore, it might be helpful to know the following: (a) how many times has this occurred in the past, (b) what happened over the next two years in the bond and stock markets, and (c) historically, after such a rare extended bond market condition, which major asset class provided the better risk-reward profile in the historical cases?
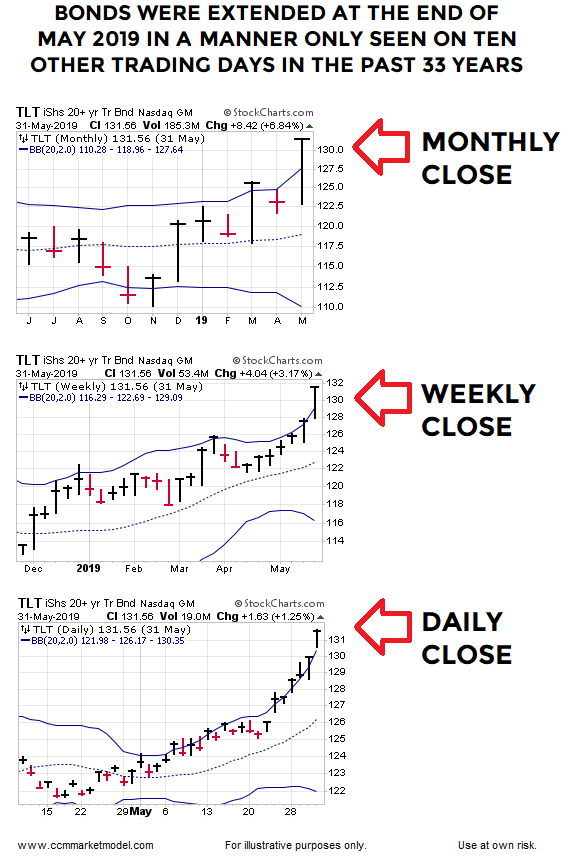
Since finding simultaneous monthly, weekly, and daily closes above the upper Bollinger® Band for TLT was so rare, we also performed similar studies to better understand historical tendencies in cases with larger and more meaningful sample sizes. Thus, we addressed the questions above by studying three data sets (n = 10, n = 18, and n = 51).
STUDY ONE: MONTHLY, WEEKLY, AND DAILY
The first case is extremely rare. Since TLT historical data is limited, we also used Vanguard Long-term Treasury Fund Investor Shares as a proxy for TLT. Data for VUSTX dates back to 1986. Thus, all three studies cover data going back to 1986. We examined data for approximately 8,349 trading days, assuming a typical year has 253 sessions.
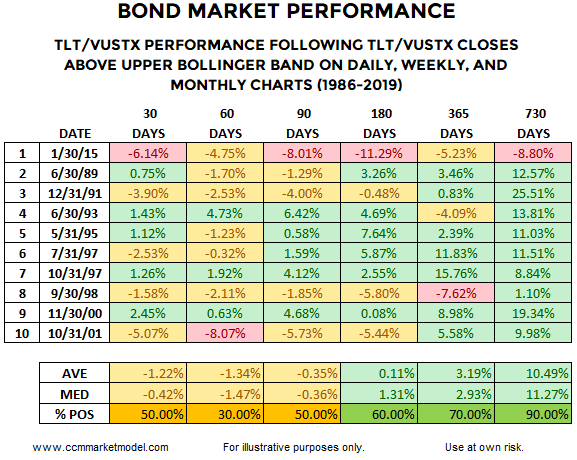
You can make an argument that pushing TLT above the upper Bollinger Band on monthly, weekly, and daily charts speaks to a somewhat overextended market, especially from a short-term perspective. How did bonds perform following such a rare extended condition? Over the next 90 days, the extended market tended to take a break, posting negative average and median returns. How many trading days featured simultaneous monthly, weekly, and daily TLT/VUSTX closes above the upper Bollinger® Band? The answer is 10 trading days. What happened next in the bond market?
How did the stock market perform after bonds hit an extremely rare and extended trifecta? Historically, quite a bit better than bonds. Rather than posting negative average and median returns looking out 90 days, stocks posted green figures.
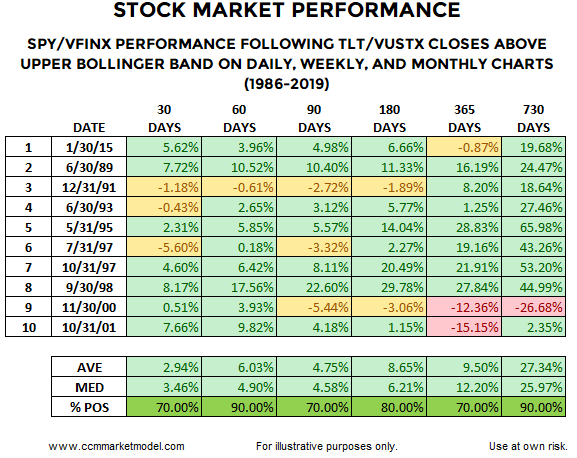
It is also important to note, the expectancy for stocks over the following 30 days to 2 years was quite a bit more attractive than the expectancy for bonds. For example, over the next 90 days bonds were only green in 50% of the cases and the average loss was 0.35%, which is quite a bit less attractive than stocks that saw 70% green outcomes with an average gain of 4.75%. Over the next 60 days, stocks beat bonds by an average of 7.37%, which intuitively passes the supply and demand common sense test, given the rare one-sided nature of an extended bond market.
STUDY TWO: MONTHLY AND WEEKLY
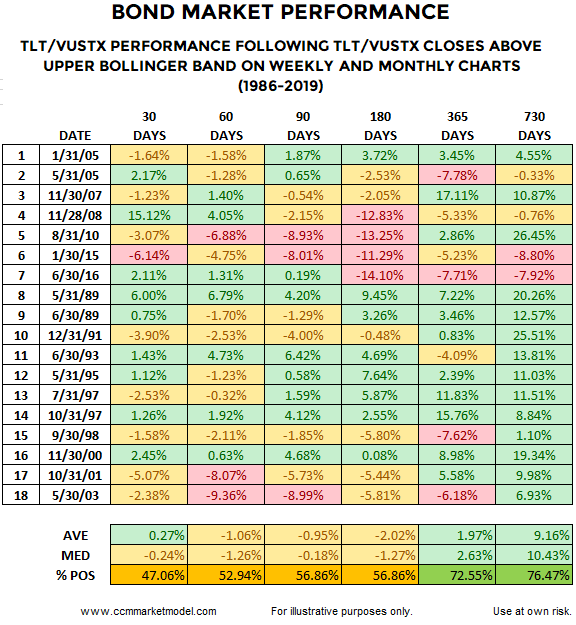
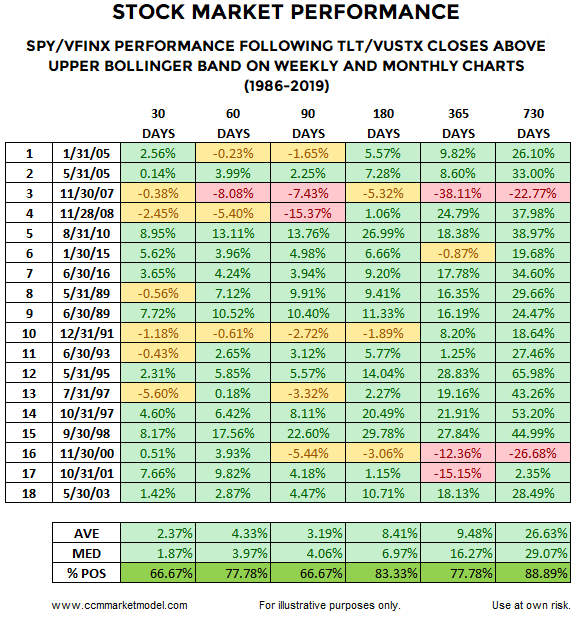
In order to get our sample size up and allow us to look at tendencies, we examined historical cases that posted TLT/VUSTX closes above both the monthly and weekly upper Bollinger® Band. Dropping the daily requirement brought the historical cases up to 18. The results were very similar; the average and median outcome clearly favored stocks over bonds. Over the next 180 days, stocks beat bonds by an average of 10.43%.
STUDY THREE: MONTHLY
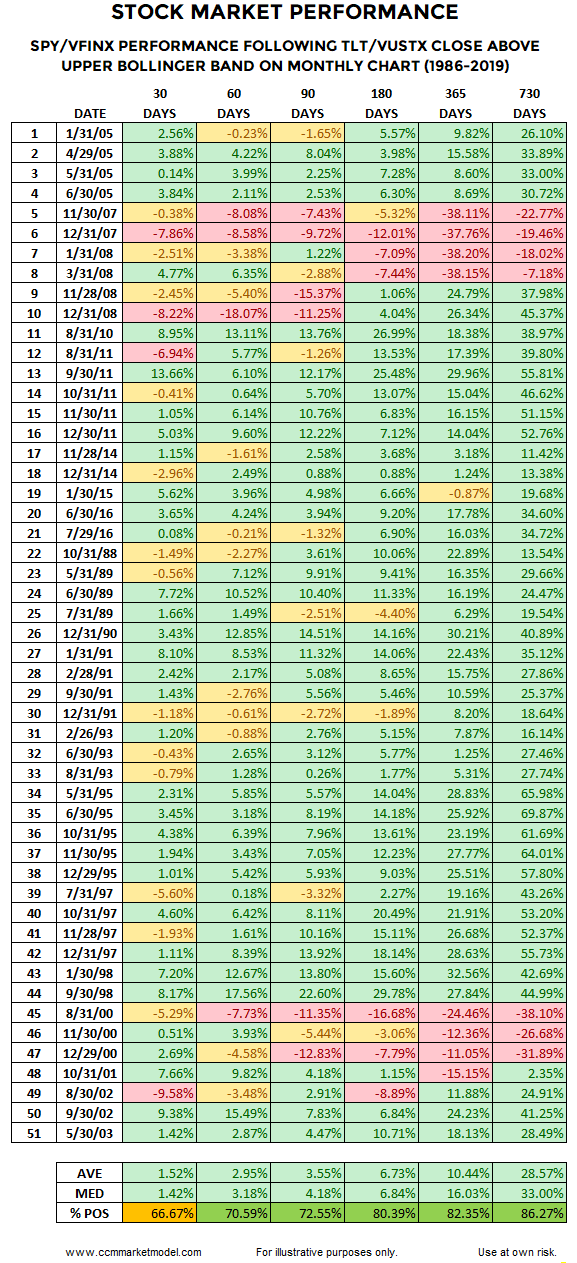
Since TLT closed above the upper monthly Bollinger® Band on May 31, 2019, we can still learn something by examining similar monthly closes in TLT/VUSTX history. The less restrictive criteria brings the number of historical cases to 51. Once again, the results are similar; average and median outcomes, along with the percent of positive outcomes, clearly favored stocks over bonds looking out between 30 days and 2 years.
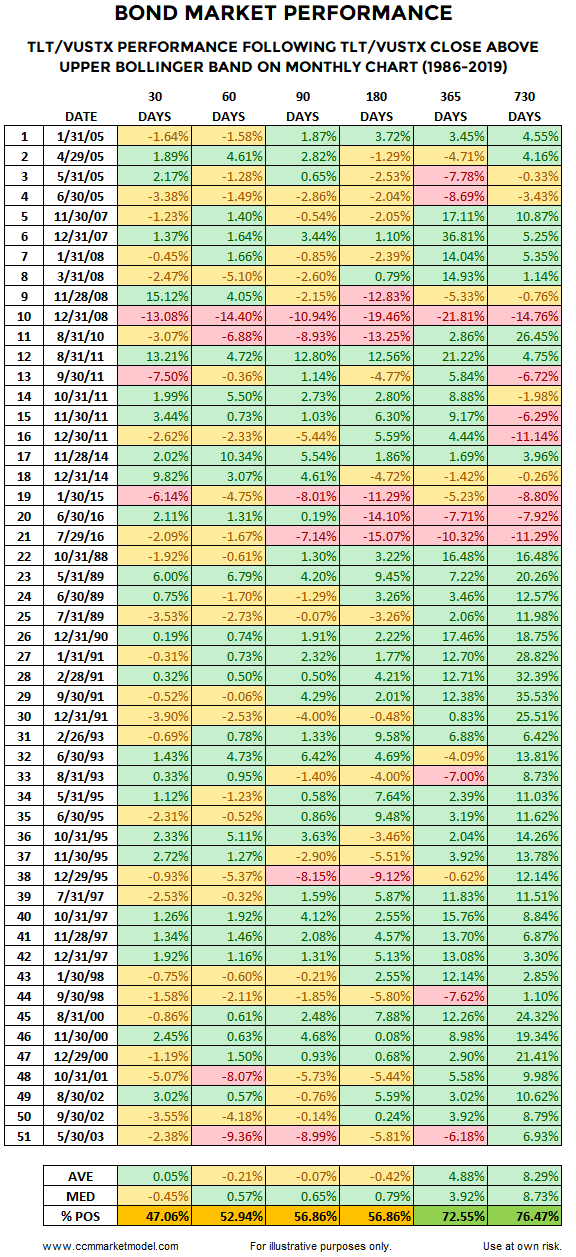
Over the next 180 days, stocks beat bonds by an average of 7.15%, with 80% of stock cases resulting in green figures; bonds only posted green results in 57% of the cases.
RARE FUNDAMENTAL ISSUES NOT UNIQUE TO 2019
The trade war and tariffs are legitimate concerns in 2019. However, every historical case cited featured a unique set of fundamental and technical concerns; otherwise, the bond market would not have reached such a rare and extended state.
DOES ANY OTHER EVIDENCE ALIGN WITH THE EXTENDED BOND MARKET?
Given the recent pullback in stocks and negative trade developments, this week’s video updates numerous “this just happened in 2019” studies. The video also looks at the bond and stock markets from additional perspectives.
