What Investments Have a Low Correlation to Stocks?
If we are concerned about the possibility of a stock market correction or sideways malaise, where do we go to keep our heads above the inflationary waters? After all, going to “cash” — money market funds and short-term Treasuries — gives us roughly 1/15th of what we need to preserve our capital in terms of actual buying power. There are a number of avenues that may or may not appreciate in value, but which at least have the virtue of providing little or no correlation to the stock market.
Non-convertible preferred stocks and many types of bonds provide scant correlation to the stock market. When purchasing these, I think it makes sense to take advantage of the institutional-size buying power of mutual funds, closed-end funds and ETFs. I may be in the minority of advisors in this approach; many advocate “eliminating the middleman” and buying bonds directly. I doubt they were ever on the inside of a brokerage firm as I was, however. I assure you, the market for individual bonds is opaque at best and rigged against the individual at its worst.
Rather than fight that fight at the individual level, we’ll spend our time selecting the best funds and let them go toe to toe with their institutional peers. Also, the food, energy, and industrial and precious metals resources we use in our daily lives and manufacturing respond more to the supply and demand of the actual product rather than the supply of stock for sale versus the demand from the buyers of that equity.
I would never advocate that an individual investor step into the trading pits with the scores of forecasters, agronomists, geologists, and petroleum engineers the biggest companies in the world employ and try to buy and sell commodities futures. But, again, there are now funds that do just this, and more funds that simply passively invest in the underlying coffee, orange juice, corn, wheat, gold, tin, zinc, silver, et al commodities which—particularly if you believe interest rates might rise over the coming months and years—will rise accordingly.
It is in these two key areas that we look to defend against a possible market decline but still keep our capital intact with what I believe is a greater likelihood of gains in the coming months.
Bonds and Preferreds
Last month, I discussed the RiverPark Strategic Income Fund (RSIVX) and gave the reasons why it is a favorite choice of ours. You’ll recall that we bought RSIVX because we believe it is small enough to find bargains too small for the bigger bond funds but large enough to go head-to-head with the big bond traders to get the best deals for their shareholders.
As I wrote then:
With $120 million under man-agement, they are big enough to buy in quantity but small enough to find the outliers that are too small for the mega-funds to profit from. This might then include issu ers in distress but with no risk of losing the principal even if the firm went bankrupt (due to cash and other asset holdings;) less liquid bonds; floating rate bonds; and bonds management assesses to be mispriced, often be-cause of their relative illiquidity. Held to maturity 3 years hence, however, the ability to re-sell becomes moot….In short, David Sherman and his team are bright, experienced, opportunistic bond professionals.
I believe I’ve identified a couple more mutual funds worthy of our attention, as well as some ETFs and a closed-end fund.
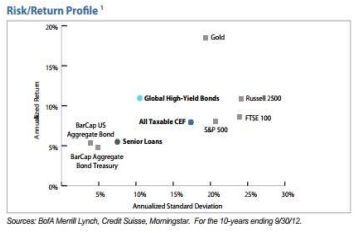
The first, RiverNorth/Oaktree High Income (RNOTX,) is a unique collaboration two rather different styles: RiverNorth provides tactical asset allocation via investments in closed-end funds (CEFs), and Oaktree, a huge institutional bond investment firm, specializes particularly in high yield and/or distressed debt and convertible bonds and preferreds. RNOTX is, at heart, an Oaktree core credit fund with a high income and very opportunistic CEF kicker managed by RiverNorth. Oaktree has the flexibility to allocate between their high-yield and senior loan strategies, while RiverNorth focuses on income-producing CEFs purchased at a discount, whether stocks, bonds, preferreds or any other asset class, as long as the end result includes solid income and total return.
The chart below shows that (at least in theory!) a strategy like this one might offer equity-type returns with something approaching the lower volatility of bonds.

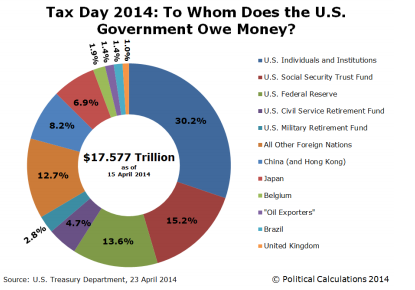
The chart below, courtesy of Craig Eyermann via Doug Short’s superb dshort.com website, is a real eye-opener when discussing US indebtedness. We hear all sorts of lies, half-truths and hyperbole depending upon whose ox is in danger of being gored. This chart shows, in one place, just who the US government is really “indebted” to. US individuals and institutions comprise the bulk of the debt, at 30.2%. But the next biggest is not a debt-holder (as in bonds and such) but is the out-of-control use of Congressional IOUs that fund current pay-ments out of the Social Security Trust Fund accounts and are on the books to be repaid. They may or may not be.

Next is the Fed itself, whose members own just over 13% of US Treasury debt, followed by the Civil Service Retirement Fund, a defined-benefit anachronism in a world of defined-contribution plans in the private sector.
The same can be said for military pensions, too, though they comprise a far smaller piece of the pie than crusading legislators and the current administration make them out to be. Someone is always trying to reduce military benefits or pay on the backs of those already promised via contract that those benefits wouldn’t be broken. But, clearly, something has to give, and a new defined-contribution matching plan that allows a soldier to receive something for every year of service would be vastly superior to the current all-or-nothing plan. (Serve 20 years, get a pension. Serve 19, too bad, so sad.)
The rest of the debt, roughly 32%, is owed to foreign nations. Our plan is to avoid most US government debt and instead buy the best foreign debt and US and foreign corporate debt. In addition to doing so via mutual funds, there are a number of ETFs and CEFs we like. First among equals here is closed-end fund PIMCO Dynamic Credit Income (NYSE: PCI). PCI currently sells at a discount to NAV of 5.5%. That may help your monthly-payout yield but don’t get too excited about the discount. Most CEFs sell at a discount and the range for PCI over the past 52 weeks has been between –0.12% and –10.75%.
I do like the fact, however, that right around these levels, Bill Gross, PIMCO’s co-founder and Chief Investment Officer, has been buying shares of PCI in the open market. The fund yields just over 8% per annum, paid monthly, and is comprised of higher-quality income offerings.
Municipal Bonds
Many advisors will tell you not to bother seeking tax-free income unless you are in one of the higher tax brackets. Phooey. If the safety you seek and the after-tax yield you seek can be found in a muni, I say buy it no matter what your bracket. Right now, with some highly-publicized problems with some municipal bonds, you can find returns that are worthwhile. The Market Vectors High Yield Muni ETF (ARCA:HYD) being high yield, takes us a bit further out on the risk spectrum but provides a 5.6% return with sufficient liquidity and diversification to pique our interest. If you prefer a CEF, Invesco Municipal Trust (NYSE: VKQ) sells at an 8% discount and offers a slightly higher 6.4% annual yield, payable monthly.
Things We Eat, Drink, Wear and Build With
The term “commodities” means different things to different people. For many, it conjures the image of buying a futures contract and seeing 1,000 pork bellies dumped on your front lawn. Never happened, never will.
Indeed, commodities, in a nutshell, are simply things we use all the time because of their utility. Some are quite abundant, like wheat and corn, some are rather more rare, like gold and platinum.

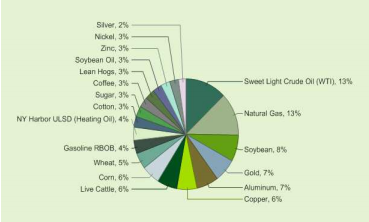
The chart above, for instance, shows the composition of the iPath DJ-UBS Commodity ETN (NYSE:DJP). You can see it in all its granularity there; the “bigger picture” is that these all add up to a portfolio that is about 39% agricultural, 33% energy, 19% industrial metals and 9% precious metals. As CIO for Stanford Wealth Management, I choose to buy funds like this rather than indulge in the game of trying to figure out which commodities will do best.
I like the diversification over a range of broad consumer staples and industrially-necessary metals and energy sources. I also, however, particularly like the prospects for agricultural commodities in this particular year so I am willing to accept slightly less diversification by buying another fund in addition to DJP. This one is the PowerShares DB Agriculture Fund (ARCA:DBA) which readers with longer memories will recall we have owned and sold profitably on more than one previous occasion.
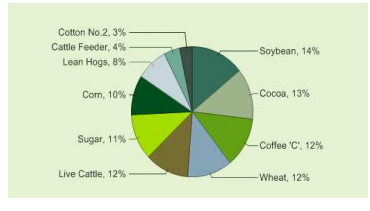
The chart below shows the percentage of the portfolio in each of the key agricultural areas:

I like the commodity funds whenever the market looks to be weak simply because there is so little correlation between the two. But I think this year “may” be particularly good to the agricultural area. The reason is straightforward — and may or may not come to pass: Temperatures in the Pacific Ocean are looking to be warmer than normal this year, prompting weather forecasters to predict the likelihood of yet another El Niño year in 2014. If they are correct, that often portends more volatile times for commodities, particularly agricultural commodities, with a distinct bias to the upside.
And this year, many commodities are already in short supply as wars, drought and already-strange weather patterns have crimped production. (Parenthetically, nickel also typically moves up in El Niño years because El Niños are characterized by creating drought conditions in Australia and Indonesia, two of the largest nickel-producing nations, with the latter in particular dependent on hydroelectric power to fuel their smelters.)
Other effects of the El Niño phenomenon are very wet weather in both Chile and Brazil, with possible flooding, and therefore reduced production, of the copper mines in Chile, and heavy rains delaying the Brazilian coffee harvest. (Brazil is the world’s top coffee producer.)
Meanwhile, on the other side of the world, less rain from India to Australia often means smaller rice and sugar crops in India and smaller wheat and other grain crops in Australia. Wetter than normal weather also takes a bite out of cocoa production. You’ll notice cocoa is 13% of the DB Agriculture Fund’s portfolio. (And, for chocolate lovers, is every bit as important as the impact to one’s equities portfolio. Of course, if this trade works out, you can pay for any increase in the price of your chocolate out of the profits earned here!
That’s the logic we use when we buy energy stocks when we think gas prices are going up. Might as well let the producers put money back in our pocket to replace what they take out at the pump…)
The bottom line? None of this may come to pass. Weather forecasters have been wrong before. But if El Niño doesn’t visit us this year, we are still invested in something with a low correlation to what may be a difficult six months or more for the stock markets. If it does? We have the chance to make good money in bad times, rather than merely defend against the decline.
