🐂 Not all bull runs are created equal. November’s AI picks include 5 stocks up +20% eachUnlock Stocks

AECOM: Resuming Rally Toward $50

Published 09/18/2017, 10:59 AM
Updated 03/09/2019, 08:30 AM
ACM
-

Aecom Technology Corporation (NYSE:ACM) provides planning, consulting, architectural and engineering design and program and construction management services for a range of projects including highways, airports, bridges, mass transit systems, to government and commercial clients. The company had US$17.4 billion of revenue during fiscal year 2016, it's been ranked number one in Engineering News Record‘s “Top 500 Design Firms” for 8th consecutive year and named one of Fortune magazine’s “World’s Most Admired Companies” for the third consecutive year.

From 2008 low, AECOM stock is showing 5 swings incomplete bullish sequence which is different from the regular impulsive 5 waves move as we use this sequence as part of our new way of applying Elliott Wave Theory to the market. We believe that many instrument has the ability to trend using corrective Elliott wave structure rather then trending in 5 waves move, so this move is considered as part of a double three structure which has 7 swings.

AECOM managed last year to make new all time high, so using 2014 peak & 2016 low as a connector, the stock is looking to extend higher toward equal legs area 46.53 - 52.14 before ending the cycle from 2008 low.

AECOM Weekly Chart
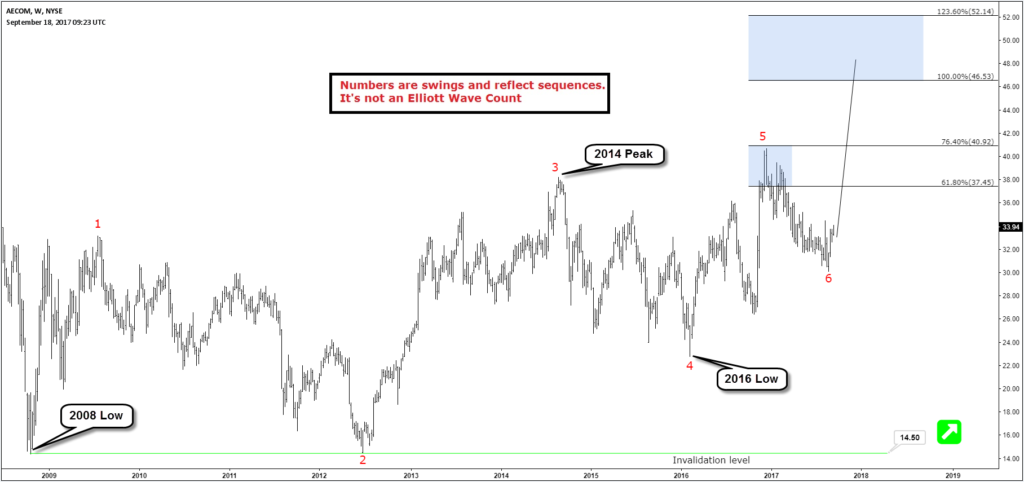
AECOM Weekly Chart

AECOM ended 3 waves pullback from 12/12/2016 peak after it reached the 50-61.8 fib retracement area 31.75 - 29.63, so currently as long as it remains above the recent August low at 30.15 and most importantly as long as 22.84 pivot keeps holding then AECOM will extend higher to make new all time highs and reach the target around the $50 area.

AECOM Daily Chart
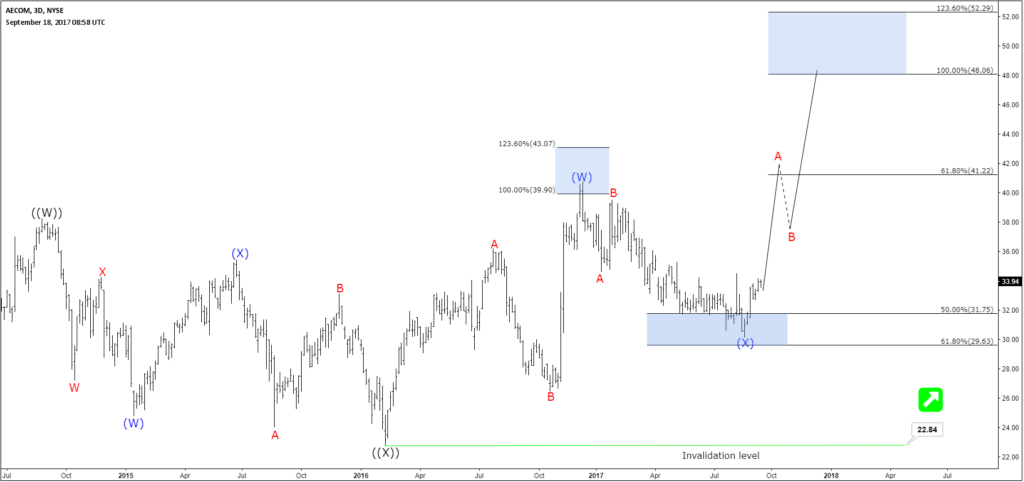
AECOM Daily Chart

Recap
AECOM has a bullish structure and technically it has resumed the move higher unless the move truncates without reaching the target and decide to make the double correction from 2016 peak. It's not recommended to sell it and it's better to look for buying opportunity during short term pullbacks using corrective structures in 3 , 7 or 11 swings.

Latest comments

Loading next article…
Risk Disclosure: Trading in financial instruments and/or cryptocurrencies involves high risks including the risk of losing some, or all, of your investment amount, and may not be suitable for all investors. Prices of cryptocurrencies are extremely volatile and may be affected by external factors such as financial, regulatory or political events. Trading on margin increases the financial risks.
Before deciding to trade in financial instrument or cryptocurrencies you should be fully informed of the risks and costs associated with trading the financial markets, carefully consider your investment objectives, level of experience, and risk appetite, and seek professional advice where needed.
Fusion Media would like to remind you that the data contained in this website is not necessarily real-time nor accurate. The data and prices on the website are not necessarily provided by any market or exchange, but may be provided by market makers, and so prices may not be accurate and may differ from the actual price at any given market, meaning prices are indicative and not appropriate for trading purposes. Fusion Media and any provider of the data contained in this website will not accept liability for any loss or damage as a result of your trading, or your reliance on the information contained within this website.
It is prohibited to use, store, reproduce, display, modify, transmit or distribute the data contained in this website without the explicit prior written permission of Fusion Media and/or the data provider. All intellectual property rights are reserved by the providers and/or the exchange providing the data contained in this website.
Fusion Media may be compensated by the advertisers that appear on the website, based on your interaction with the advertisements or advertisers.
© 2007-2024 - Fusion Media Limited. All Rights Reserved.