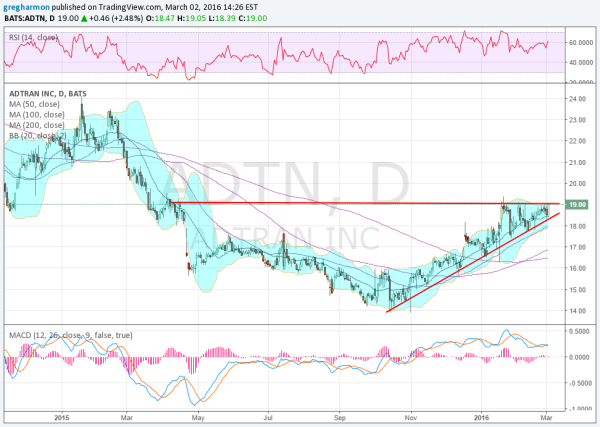
Adtran (NASDAQ:ADTN) had a rough 2015. The stock price fell hard starting in February. It paused a bit in April but then resumed lower and finally bottomed in October. When it was done it had lost over 40% of its value from the beginning of the year. But since that bottom, things have been looking up.
The chart below shows the rising trend that has been in place since late October. Almost straight and steady higher. Now the price of the stock is back at the bounce level from April 2015 and consolidating. This forms a cup and begs the question of whether a handle is close behind. This would look for a pullback and then retest of the resistance zone.

But a handle does not have to happen. In fact, the short-term view suggests that the stock could just break resistance and run higher. Four things on the chart in particular suggest this. First, the bullish engulfing candle forming Wednesday. With no upper shadow this would support a break out higher. Second, the Bollinger Bands® had squeezed and are now opening to the upside. Next, the RSI continues in the bullish range. And finally, the MACD is moving back higher after a pullback.
Add these to the rising SMAs and current trend and you had best not be waiting on a pullback. A break to the upside would give a pattern target of 21 and the 23. Wait for the trigger but be prepared.
Disclaimer: The information in this blog post represents my own opinions and does not contain a recommendation for any particular security or investment. I or my affiliates may hold positions or other interests in securities mentioned in the blog, please see my Disclaimer page for my full disclaimer.
