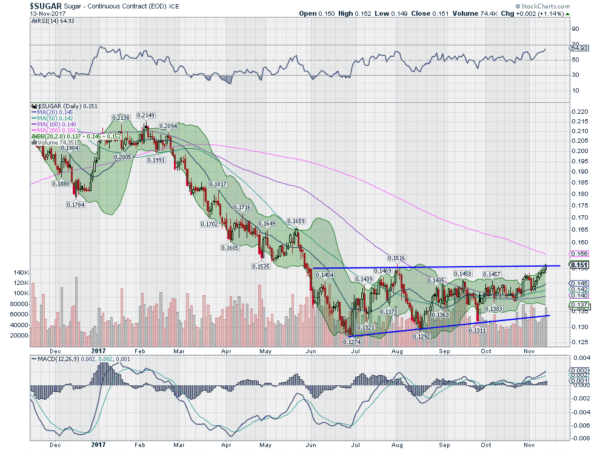
Sugar more than doubled in price as it moved from a low in August 2015 to a peak in September 2016. But since then it collapsed. In three waves down it finally bottomed in June this year. It gave back over 80% of the gain when it was over. But this time it was not followed by a reversal.
Instead it was followed by what has been a 5 month consolidation. The chart below shows the last wave down and the consolidation. Since June it has moved sideways under resistance. But it has also been making higher lows along the way, tightening the consolidation range. The result was an ascending triangle.

Monday the price ended peaking above resistance. Will it break out and continue higher? If so the pattern would give a price objective to 0.1750. That would be a solid reversal and put it well over the 200 day SMA for the first time since the start of that last wave down. Momentum supports a over resistance. The RSI is now in the bullish zone and rising and the MACD is doing the same. Even the Bollinger Bands® are opening to the upside. Time to add a teaspoon of sugar to your portfolio.
The information in this blog post represents my own opinions and does not contain a recommendation for any particular security or investment. I or my affiliates may hold positions or other interests in securities mentioned in the Blog, please see my Disclaimer page for my full disclaimer.
