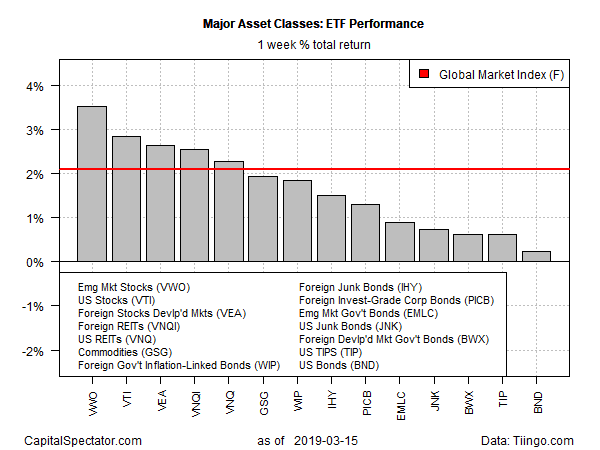
Bullish sentiment boosted prices across all the major asset classes last week, based on a set of exchange-traded funds. The clean sweep of gains marks the first time in six calendar weeks that every corner of global markets rallied, as of trading through Friday, March 15.
Leading the upswing: emerging-market stocks. Vanguard FTSE Emerging Markets VWO posted a 3.5% increase last week. The strong rise marked the best week for the ETF since last November.
By some accounts, the rally in emerging markets still has room to run. Barron’s reasons that:
conditions remain ripe for a further rally in emerging markets, investors say. The macro risks that have been frightening investors—from a Chinese hard landing to an escalating Washington-Beijing trade war—seem to be lessening. The U.S. economy is slowing to a “Goldilocks” pace from the standpoint of emerging markets: vigorous enough to support global growth, but measured enough to keep the Federal Reserve dovish. And valuations remain cheap by historical standards.
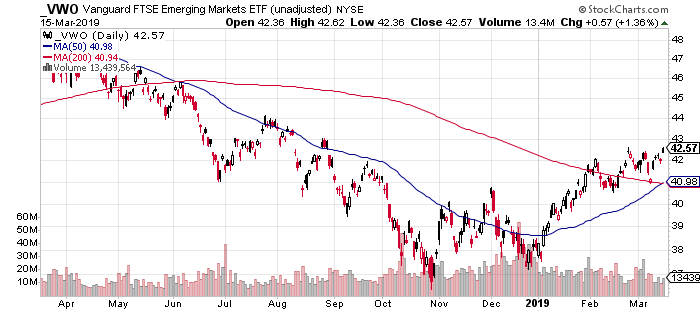
From a technical perspective, the upside bias looks encouraging for VWO, based on a set of widely followed moving averages. On a price-only basis (before factoring in distributions), the ETF’s 50-day moving average crossed above its 200-day average for the first time since last June.
“Our central position is for positive outcomes on the big issues,” Jorge Mariscal, chief investment officer for emerging markets at UBS Global Wealth Management, tells Barron’s. “We are overweight global emerging market equities.”
Last week’s smallest gain for the major asset classes: a broad measure of investment-grade bonds in the US. Vanguard Total Bond Market (BND) rose 0.2%, marking the ETF’s second straightly weekly gain.
Last week’s rally also lifted an ETF-based version of the Global Markets Index (GMI.F). This investable, unmanaged benchmark that holds all the major asset classes (except cash) in market-value weights rose a solid 2.1% — the benchmark’s best weekly advance so far this year.
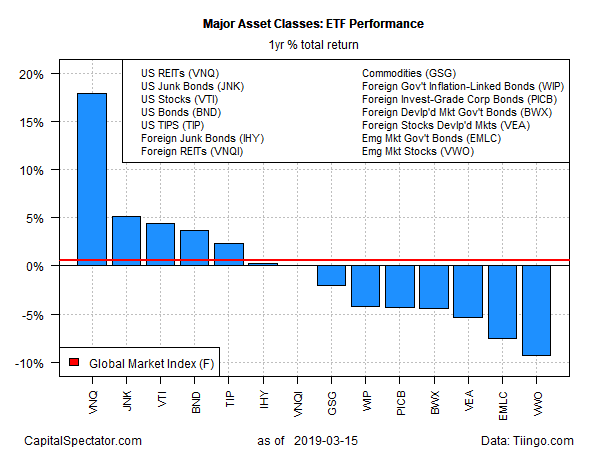
For the one-year window, US real estate investment trusts (REITs) continue to deliver the top performance by far. Vanguard Real Estate VNQ is up a strong 18.0% over the past 12 months on a total-return basis – far above the one-year results for the other major asset classes.
The weakest performance for the one-year window: emerging-market stocks. Despite last week’s powerful rally, VWO remains underwater by 8.9% as of Friday’s close vs. the year-earlier price, even after factoring in distributions.
GMI.F’s one-year performance is positive — just barely — via a 0.6% total return for the past 12 months.
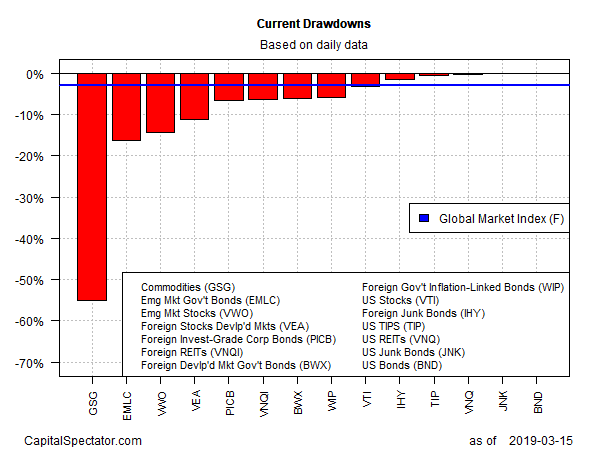
For drawdown, BND leads the field by closing on Friday at a new high – a zero drawdown.
Meantime, a broad measure of commodities still posts the biggest drawdown for the major asset classes: iShares S&P GSCI Commodity-Indexed Trust GSG is down more than 50% from its previous peak.
GMI.F’s current drawdown is a mild -2.8% at the moment.


