
Accenture plc (NYSE:ACN) reported better-than-expected third-quarter fiscal 2017 results. The company posted non-GAAP earnings of $1.52 per share, which came a couple of cents ahead of the Zacks Consensus Estimate. The non-GAAP figure includes a settlement charge of 47 cents per share related to the termination of its U.S. pension plan. Moreover, earnings increased from $1.41 per share on a year-over-year basis.
Revenues and Bookings
Accenture’s fiscal third-quarter net revenue increased 5.1% year over year to $8.867 billion and surpassed the Zacks Consensus Estimate of $8.815 billion. In local currency terms, revenues grew 7% year over year. Net revenue also came within the guided range of $8.65 billion and $8.90 billion.
The year-over-year increase was primarily aided by a 4% increase in Consulting revenues ($4.82 billion). Outsourcing revenues were up 6% on a year-over-year basis ($4.05 billion). It is worth mentioning that both Consulting revenues and Outsourcing revenues increased 6% and 7% in local currency, respectively.
Among the operating segments, Communications, Media & Technology revenues were up 3% on a year-over-year basis to $1.75 billion. Revenues from Health & Public Services and Financial Services increased 1% and 3% year over year to $1.56 billion and $1.87 billion, respectively. Revenues from Products and Resources increased 13% and 2% year over year to $2.43 billion and $1.25 billion, respectively.
Geographically, revenues from North Americas and Europe advanced 3% each. Revenues from Growth Markets (Asia Pacific, Latin America, Africa, the Middle East, Russia and Turkey) increased 16% on a year-over-year basis.
Accenture reported $9.8 billion worth new bookings, which includes a negative impact of 1% due to foreign currency fluctuation. Consulting bookings and Outsourcing bookings for the reported quarter totaled $5.2 billion and $4.6 billion, respectively.
Operating Results
Fiscal third-quarter gross margin expanded 110 basis points (bps) on a year-over-year basis to 31.1%, primarily due to a higher revenue base.
Accenture’s non-GAAP operating income was $1.38 billion or 15.5% of net revenue compared with $1.31 billion or 15.5% of revenue reported in the year-ago quarter. Accenture reported $1.21 billion in non-GAAP net income or $1.52 per share compared with $950.3 million or $1.41 per share reported in the year-ago quarter.
Accenture PLC Price, Consensus and EPS Surprise
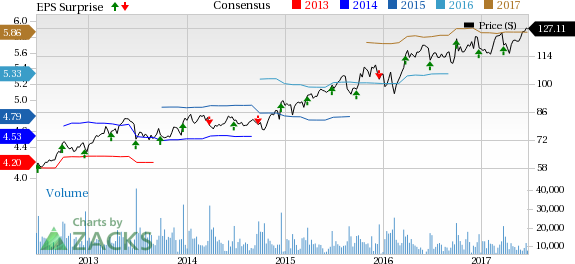
Accenture PLC Price, Consensus and EPS Surprise | Accenture PLC Quote
Balance Sheet & Cash Flow
Accenture exited the fiscal third quarter with a total cash balance of $3.38 billion compared with $3.24 billion in the preceding quarter. The company’s long-term debt balance at the end of the quarter was $24.7 million.
Operating cash flow for the quarter was $1.79 billion, while free cash flow was $1.66 billion.
Share Repurchase and Dividend
In line with its policy of returning cash to shareholders, Accenture repurchased 4.9 million shares for $589 million during the fiscal third quarter. The company also paid a semi-annual cash dividend of $1.21 per share during the quarter.
Guidance
For fourth-quarter fiscal 2017, Accenture expects net revenue between $8.85 billion and $9.10 billion (mid-point $8.975 billion). The Zacks Consensus Estimate is pegged at $8.92 billion. The company did not provide any earnings per share guidance.
Accenture lowered its revenue guidance range for fiscal 2017. The company now expects net revenue to grow in the range of 6–7% in local currency (previously 6–8%).
Furthermore, due to settlement charge of 47 cents related to the termination of its U.S. pension plan, the company has revised its earnings guidance range for the fiscal. Earnings per share on GAAP basis are now projected in the range of $5.37–$5.44. On non-GAAP basis, it anticipates earnings in the range of $5.84–$5.91. The Zacks Consensus Estimate is pegged at $5.86.
Including an impact of 150 bps related to the pension settlement charge, Accenture now estimates operating margin to be approximately 13.3%. Excluding the same, it anticipates operating margin of 14.8%. The previous guidance was between 14.7% and 14.9%.
For fiscal 2017, the company expects operating margin in the range of 14.7–14.9%. The effective tax rate projection has been lowered to 20.5–21.5%, down from previous guidance range of 22–24%. Accenture continues to expect operating cash flow of $4.6–$4.9 billion and free cash flow of $4–$4.3 billion.
Our Take
Accenture delivered strong second-quarter fiscal 2017 results, wherein the top and bottom lines, both, surpassed the respective Zacks Consensus Estimate and marked year-over-year improvement.
However, the company’s downbeat revenue guidance for fiscal 2017 makes us skeptical about its near-term performance.
Going ahead, Accenture’s recent announcement of creating 15K new jobs by 2020 and investment plan of $1.4 billion for employee training and opening of 10 innovation centers across the U.S. cities may dent its bottom-line results, in our opinion. Additionally, increasing competition from peers such as Cognizant Technology Solutions (NASDAQ:CTSH) and International Business Machines Corporation (NYSE:IBM) , and an uncertain macroeconomic environment may deter its growth to some extent.
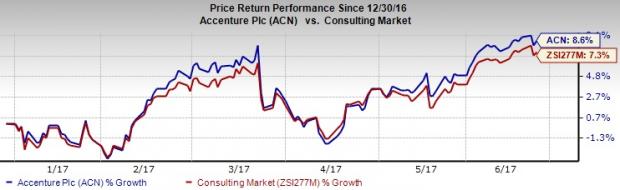
Shares of Accenture were down more than 2.5% in pre-market trading. Notably, the company has outperformed the Zacks categorized Consulting Services industry in the year-to-date period. The stock returned 8.6% in the said period, while the industry gained 7.3%
Accenture currently has a Zacks Rank #4 (Sell).
Investors may consider NV5 Global Inc. (NASDAQ:NVEE) , which carries a Zacks Rank #2 (Buy). You can see the complete list of today’s Zacks #1 Rank (Strong Buy) stocks here.
NV5 Global has a long term-expected EPS growth rate of 20%.
Looking for Ideas with Even Greater Upside?
Today's investment ideas are short-term, directly based on our proven 1 to 3 month indicator. In addition, I invite you to consider our long-term opportunities. These rare trades look to start fast with strong Zacks Ranks, but carry through with double and triple-digit profit potential. Starting now, you can look inside our home run, value, and stocks under $10 portfolios, plus more.
Click here for a peek at this private information >>
International Business Machines Corporation (IBM): Free Stock Analysis Report
Cognizant Technology Solutions Corporation (CTSH): Free Stock Analysis Report
Accenture PLC (ACN): Free Stock Analysis Report
NV5 Global, Inc. (NVEE): Free Stock Analysis Report
Original post
Zacks Investment Research