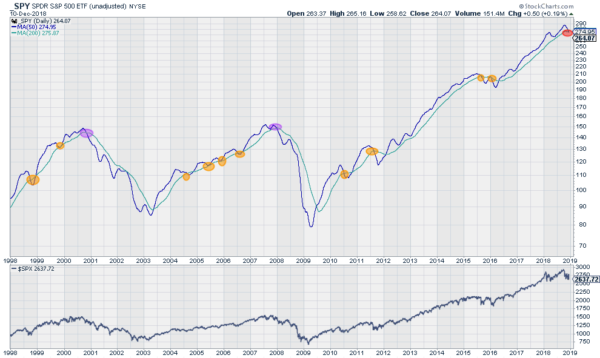
It sounds horrid. Like the end of times. A Death Cross. What good could ever come of this? It conjures up foul images. Carnage and debauchery. Blood and gore everywhere. This is why we hear of it. It makes for good clickbait. But what about those Death Crosses?
A cross of the 50 day SMA down through the 200 day SMA, it technically signals a short term reversal. The short term smoothed price action dropping faster than the long term smoothed price action. Certainly a change in momentum. And if the big drop is coming this will definitely happen. But a Death Cross happens a lot more frequently than just preceding a market crash.

The chart shows instances of a Death Cross over the last 21 years in the SPDR S&P 500 (NYSE:SPY) There have been 13 of them. 2 have been followed by major corrections, in 2000 and 2008. 10 have been short lived events, some with pullbacks in the index and some just a pause. The last one is happening right now. Which will it be?
Nobody knows at this point although I am sure you are hearing as many opinions as I am. The Death Cross is one indicator though. It needs to be used with many others to paint a picture. Imagine if all you needed to invest was knowledge of where the 50 and 200 day SMA’s crossed? Manage risk. Soak in all that the market has to tell you. And live without fear.
The information in this blog post represents my own opinions and does not contain a recommendation for any particular security or investment. I or my affiliates may hold positions or other interests in securities mentioned in the Blog, please see my Disclaimer page for my full disclaimer.
Which stock should you buy in your very next trade?
AI computing powers are changing the stock market. Investing.com's ProPicks AI includes 6 winning stock portfolios chosen by our advanced AI. In 2024 alone, ProPicks AI identified 2 stocks that surged over 150%, 4 additional stocks that leaped over 30%, and 3 more that climbed over 25%. Which stock will be the next to soar?
Unlock ProPicks AI