Abercrombie & Fitch Co. (NYSE:ANF) reported narrower-than-expected loss per share in first-quarter fiscal 2018, while the top line beat estimates. Further, loss per share and revenues improved compared with the prior-year quarter. Results in the quarter gained from strong performance across all brands, effective marketing and growing consumer confidence.
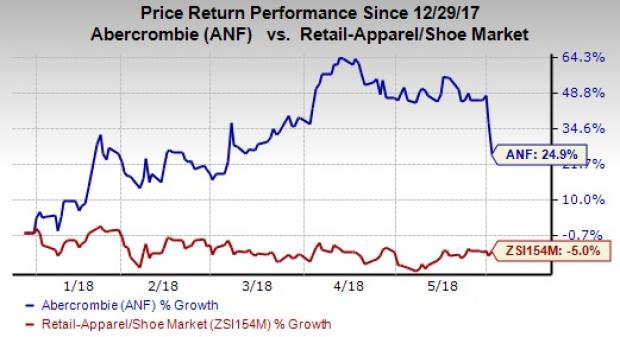
However, shares of this Zacks Rank #3 (Hold) stock declined 8.7% following the loss reported on Jun 1. Nonetheless, initiatives like strategic capital investments, cost-saving efforts, and loyalty and marketing programs aided Abercrombie to outperform the industry year-to-date. The stock gained 24.9% against the industry’s decline of 5%.

Q1 Synopsis
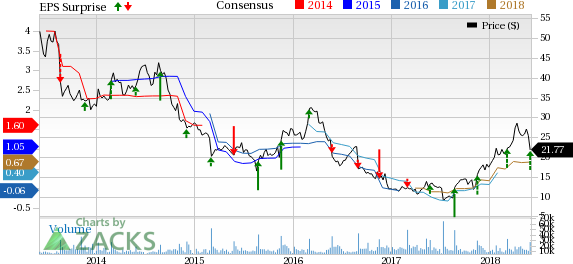
The company posted fiscal first-quarter adjusted loss of 56 per share, significantly narrower than the Zacks Consensus Estimate of loss of 79 cents. Further, loss per share improved from a loss of 91 cents per share reported in the prior-year quarter. Bottom-line results gained from an increase in comparable store sales (comps), gross margin growth and expense leverage. Further, currency tailwinds of roughly 3 cents per share, net of hedging, aided results.
Net sales of $730.9 million surpassed the Zacks Consensus Estimate of $696 million and improved 11% year over year. The upside was driven by comps growth of 5%, benefits of 1% from the additional week in fiscal 2017 and positive currency impact of 4%.
Brand-wise, net sales improved 13% to $423.6 million at Hollister while sales for the Abercrombie brand rose 7% to $307.3 million. From a geographical viewpoint, net sales grew 10% and 12% in the United States and international markets, respectively. Moreover, the company’s direct-to-consumer business continued to perform well, accounting for nearly 27% of net sales and recording 14% year-over-year increase in comp sales.
The company remains encouraged by comps performance that benefited from rise in traffic and conversion. On a segmental basis, comps for Hollister increased 6%, while Abercrombie reported growth of 3%. Moreover, comps improved 8% in the United States and were flat in the international markets.
The Hollister brand reflected persistent positive momentum, driven by strong sales growth across all channels and geographies. Abercrombie showed further signs of improvement, delivering the second consecutive quarter of positive comps backed by strength in North America due to improved traffic and conversion.
Gross profit margin expanded 20 basis points (bps) to 60.5%, owing to lower promotional activities. Gross profit margin remained flat on a constant-currency basis.
Abercrombie reported adjusted operating loss of $36.6 million, substantially wider than adjusted operating loss of $69.9 million recorded in the prior-year period.
Financials
Abercrombie ended the fiscal first quarter with cash and cash equivalents of $592 million, and gross borrowings under its term-loan agreement of $253.3 million. As of May 5, 2018, inventories were $405.1 million, up 2% from the prior-year period.
On May 22, the company declared a quarterly dividend of 20 cents per share on the Class A shares. This is payable on Jun 18, to shareholders of record as of Jun 8.
Further, the company bought back 0.8 million shares for nearly $19 million in the fiscal first quarter. The company had about 5.7 million shares remaining to be purchased under its current authorization.
Store Update
In first-quarter fiscal 2018, the company introduced only one Hollister store in the United States.
Management expects to introduce 22 full-price stores in fiscal 2018, including 13 Hollister and nine Abercrombie stores. Moreover, it plans to shut down up to 60 stores in the United States in fiscal 2018, through natural lease expirations.
Outlook
For fiscal 2018, the company now estimates both comps and sales to be up 2-4%, compared with low-single digits gain predicted earlier. Top-line gains from favorable currency rates will be offset by the absence of the additional week of sales compared with fiscal 2017. Favorable foreign currency rate is expected to contribute nearly $50 million to sales while the calendar shift will impact sales by $40 million.
The company reiterated gross margin projection for fiscal 2018. It expects gross margin to improve slightly from 59.7% recorded in fiscal 2017. The upside will stem from higher average unit retail, including currency gains, partly offset by slightly higher average unit costs.
GAAP operating expenses, including other operating income, are expected to increase nearly 2% from $2 billion adjusted operating expense recorded in fiscal 2017. Earlier, the company had projected a 1% increase.
Furthermore, the company expects effective tax rate to be mid-30s, including nearly $9 million related to share-based compensation accounting standards awards, most which were accounted in the fiscal first quarter. Through the rest of fiscal 2018, the company expects effective tax rate in mid-to-upper 20s. Further, it expects the impact from share-based compensation not to affect effective tax rate beyond 2018.
Additionally, the company expects liquidity to be strong in fiscal 2018. Abercrombie anticipates exceeding the minimum liquidity target of $700 million through fiscal 2018, as it accelerates potential investments. It envisions capital expenditures to be roughly $135-$140 million for fiscal 2018, above the prior guidance of $130 million. This will include $85 million for store updates and new stores; and nearly $50-$55 million for direct-to-consumer and omni-channel investments, information technology and other projects.
For the fiscal second quarter, the company anticipates sales growth in high single digits, including about $10 million gain from foreign currency and $30 million from the calendar shift. Operating expenses are likely to increase mid-single digits from fiscal 2017 adjusted non-GAAP operating expenses of $479 million.
Looking for Solid Picks, Check These
Some better-ranked stocks in the same industry are Shoe Carnival (LON:CCL) Inc. (NASDAQ:SCVL) and Urban Outfitters Inc. (NASDAQ:URBN) , both sporting a Zacks Rank #1 (Strong Buy), while Fossil Group Inc. (NASDAQ:FOSL) carries a Zacks Rank #2 (Buy). You can see the complete list of today’s Zacks #1 Rank stocks here.
Shoe Carnival has gained 42.5% in the last three months. The company has long-term earnings growth rate of 12%.
Urban Outfitters has long-term EPS growth rate of 12%. Further, the stock has improved 18.1% in the last three months.
Fossil Group stock has grown nearly 68.4% in the last three months. Moreover, the company has long-term EPS growth rate of 5%.
Looking for Stocks with Skyrocketing Upside?
Zacks has just released a Special Report on the booming investment opportunities of legal marijuana.
Ignited by new referendums and legislation, this industry is expected to blast from an already robust $6.7 billion to $20.2 billion in 2021. Early investors stand to make a killing, but you have to be ready to act and know just where to look.
See the pot trades we're targeting>>
Fossil Group, Inc. (FOSL): Free Stock Analysis Report
Abercrombie & Fitch Company (ANF): Free Stock Analysis Report
Urban Outfitters, Inc. (URBN): Free Stock Analysis Report
Shoe Carnival, Inc. (SCVL): Free Stock Analysis Report
Original post

