Abercrombie & Fitch Co. (ANF) through its subsidiaries, is a specialty retailer that operates stores and direct-to-consumer operations selling casual sportswear apparel, including knit and woven shirts, graphic t-shirts, fleece, jeans and woven pants, shorts, sweaters, outerwear, personal care products, and accessories for men, women and kids under the Abercrombie & Fitch, abercrombie kids, and Hollister brands.
The company was popping off of their earnings report yesterday morning. Here’s a snippet to summarize:
Abercrombie & Fitch fourth-quarter profit tumbled 79%, but that didn’t stop its stock from shooting up in pre-market trading.
Excluding one-time items, the teen-clothing designer booked $1.12 in adjusted earnings per share, about 3 cents short of Wall Street‘s forecast. Abercrombie & Fitch earned $19.6 million in the fourth-quarter, down from $92.6 million a year ago.
The clothing company faced a highly promotional holiday season and cotton prices that reached an all-time high, CEO Mike Jeffries said. “Our results for the fourth quarter were below our expectations in an extremely challenging environment. However, we are confident that we are on track with our long term strategy of leveraging the international appeal of our iconic brands to build a highly profitable, sustainable, global business,” he said in a news release. Source: Forbes via Yahoo! Finance -- Abercrombie & Fitch Shares Jump Despite Plummeting Q4 Profit.
It’s interesting that the stock movement is up. In fact, the article has a Freudian slip where it claims ANF “was down 7.02% to $47.72 in pre-market trading.”
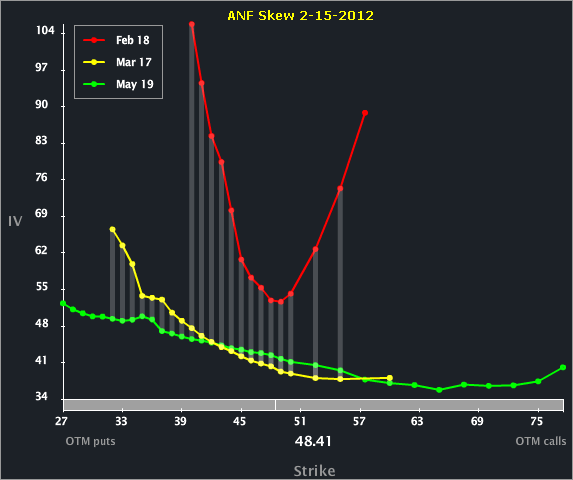
In any case, with the stock popping the front month, skew is substantially to the second month. Let’s look to the Skew Tab, below.
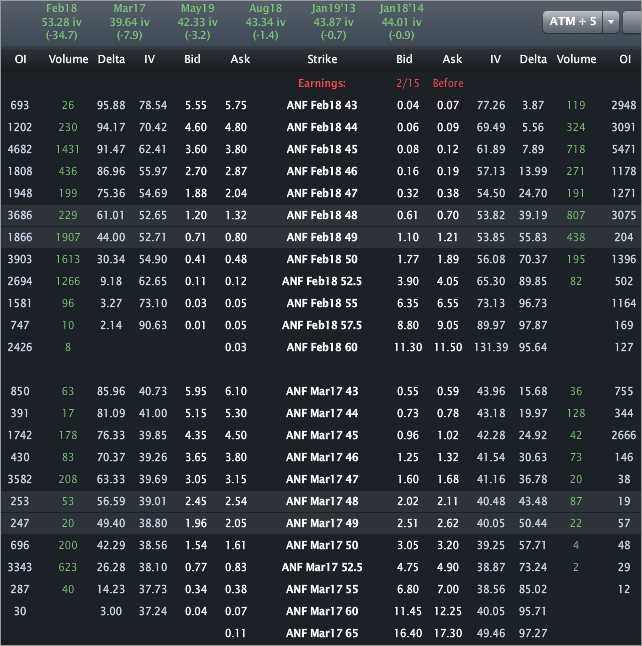
We can see the parabolic shape in the Feb vols, while the back two expiries are rather normal. Those OTM puts and calls in Feb are in fact not trivial in terms of value. Let’s look to the Options Tab for actual prices.
Check out, for example, the Feb 50 calls priced to just under 55% vol, while Mar 50 calls are priced to 38.5% vol. On the downside, the Feb 47 puts are priced to 54.5% vol compared to Mar 47 puts priced to 41.16% vol. Of course, these elevated vols in Feb are normal (or at least expected) as the front month options will remain sticky for a while as the stock finds some sort of equilibrium after this large move (and news).
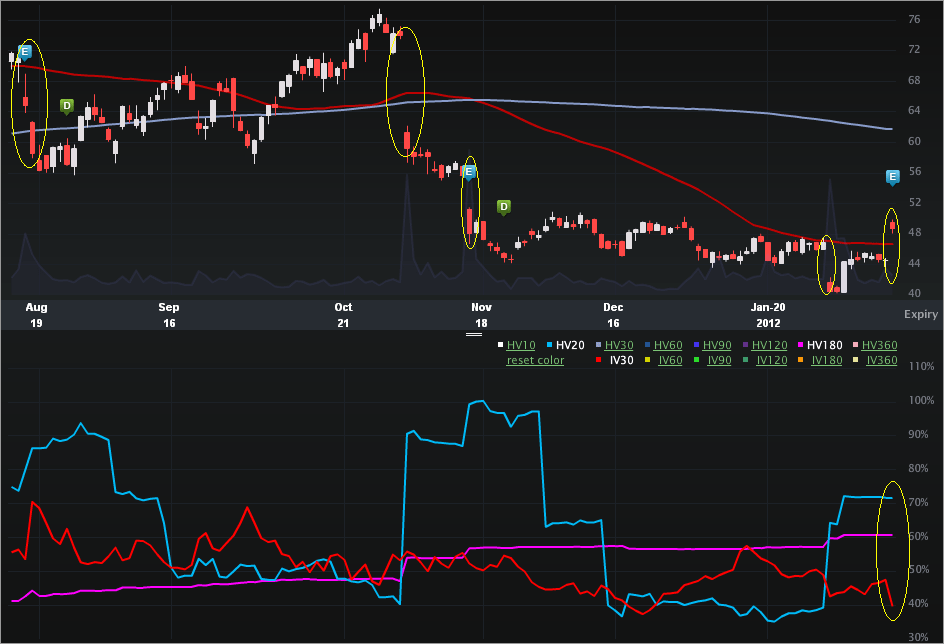
Finally, let’s look to the Charts Tab (six months), below. The top portion is the stock price, the bottom is the vol (IV30™ - red vs HV20™ - blue vs HV180™ - pink).
I wrote about this one for TheStreet (OptionsProfits), so no specific trade analysis here. But, we can see in the stock portion that I’ve highlighted a series of gaps down in ANF. Two off of earnings and two off of other news. The last bit is the pop yesterday. The point being, the stock has a tendency to gap down and in all fairness, the news yesterday wasn’t exactly awe inspiring. On the vol side, we can see how the HV20™ was already elevated from the recent drop of around 15% on 2-2-2012.
In terms of future direction, it’s not impossible that the stock rally is a mirage and that in the near-term the stock will find it’s way down. Then again, if the stock is rallying, perhaps it’s a turnaround story? OK, that wasn’t very helpful.
Ultimately, I love the vol discrepancy between the front and the back, but this is certainly a case where that gamma in Feb, at least as of right now, is properly elevated. It's possible the vol in the front will price significantly lower by the close, but the move in parity may well offset that vol move. Ya know, or not?
This is trade analysis, not a recommendation.
- English (UK)
- English (India)
- English (Canada)
- English (Australia)
- English (South Africa)
- English (Philippines)
- English (Nigeria)
- Deutsch
- Español (España)
- Español (México)
- Français
- Italiano
- Nederlands
- Português (Portugal)
- Polski
- Português (Brasil)
- Русский
- Türkçe
- العربية
- Ελληνικά
- Svenska
- Suomi
- עברית
- 日本語
- 한국어
- 简体中文
- 繁體中文
- Bahasa Indonesia
- Bahasa Melayu
- ไทย
- Tiếng Việt
- हिंदी
Abercrombie & Fitch: Stock Rips Off of Earnings; But Is It a Head Fake?
Published 02/16/2012, 12:54 AM
Updated 07/09/2023, 06:31 AM
Abercrombie & Fitch: Stock Rips Off of Earnings; But Is It a Head Fake?
Latest comments
Loading next article…
Install Our App
Risk Disclosure: Trading in financial instruments and/or cryptocurrencies involves high risks including the risk of losing some, or all, of your investment amount, and may not be suitable for all investors. Prices of cryptocurrencies are extremely volatile and may be affected by external factors such as financial, regulatory or political events. Trading on margin increases the financial risks.
Before deciding to trade in financial instrument or cryptocurrencies you should be fully informed of the risks and costs associated with trading the financial markets, carefully consider your investment objectives, level of experience, and risk appetite, and seek professional advice where needed.
Fusion Media would like to remind you that the data contained in this website is not necessarily real-time nor accurate. The data and prices on the website are not necessarily provided by any market or exchange, but may be provided by market makers, and so prices may not be accurate and may differ from the actual price at any given market, meaning prices are indicative and not appropriate for trading purposes. Fusion Media and any provider of the data contained in this website will not accept liability for any loss or damage as a result of your trading, or your reliance on the information contained within this website.
It is prohibited to use, store, reproduce, display, modify, transmit or distribute the data contained in this website without the explicit prior written permission of Fusion Media and/or the data provider. All intellectual property rights are reserved by the providers and/or the exchange providing the data contained in this website.
Fusion Media may be compensated by the advertisers that appear on the website, based on your interaction with the advertisements or advertisers.
© 2007-2025 - Fusion Media Limited. All Rights Reserved.
