My reason for investing in AAPL is simple and most likely too simplistic (or dumb) for most. I do not want to write about AAPL’s future and what their product pipeline is like. I want to reiterate that I did not buy AAPL for their product pipeline.
Instead, AAPL at the moment is a classic case of “heads I win, tails I don’t lose much."
Seth Klarman also referred to this as downside protection investing. All you have to do is protect the downside and the upside will take care of itself.
Here are the reasons I bought AAPL:
- Downside protection: balance sheet protects the business from going bankrupt. If I can find a net net with a dying business with AAPL’s balance sheet metrics, I would be all over it. So why wouldn’t I buy AAPL?
- Better than the S&P: A bet that AAPL will perform better than the market over a couple of years.
- Better than cash: I started the year with about 50% in cash. Cash makes up 1/3 of AAPL’s market cap. In other words, if AAPL was a hedge fund, I transferred my US dollars into AAPL dollars for AAPL to manage. With their management, pricing power and business strength, they are able to invest money in ways I cannot dream of.
- Priced for doom: Current valuations predict AAPL has zero growth remaining.
Rather than try to figure out what AAPL is worth, the better way is to perform various reverse stock valuation methods to see whether the current price is realistic.
The following methods from the stock analysis spreadsheet will be used:
- reverse DCF method
- reverse Graham EPS method
- reverse Absolute PE method (created by Vitaliy Katsenelson)
- reverse EPV method
All four methods are independent of each other. That is, the inputs and outputs from the DCF is not feeding the Graham model or any other model. Getting independent and unique valuations is important in determining the valuation range any stock resides.
Reverse DCF Valuation
(If the image is too small to read, do not worry, a PDF version is available at the end of the article.)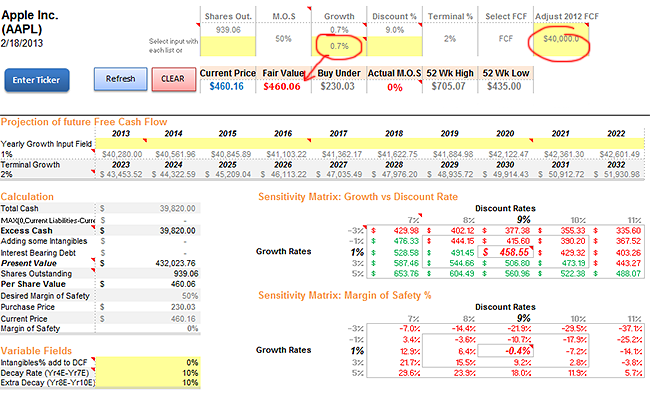
The assumptions made in the calculations is as follows:
- 9% discount rate
- $40 billion FCF
- terminal rate of 2%
This brought the market growth expectation of AAPL to 0.7% at the current price.
The actual FCF is higher that what I used, but to be conservative I lowered the FCF value to $40b.
Will AAPL grow FCF faster than 0.7%? Most likely.
Reverse Graham EPS Valuation
Using Graham’s rendition of the growth formula, let’s see what comes up.
This brought the market growth expectation of AAPL to 0.7% at the current price.
The actual FCF is higher that what I used, but to be conservative I lowered the FCF value to $40b.
Will AAPL grow FCF faster than 0.7%? Most likely.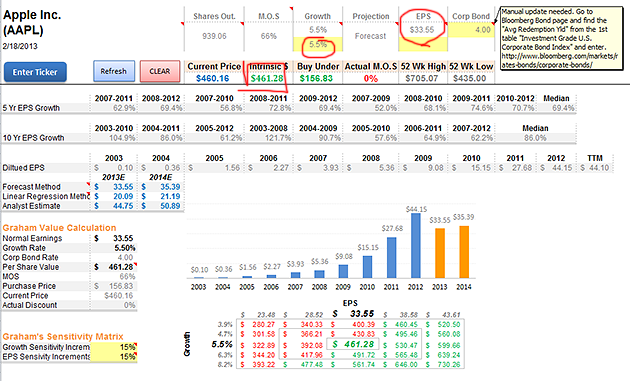
In order to try and kill the investment, I completely low balled the EPS to $33.55. This basically eliminates the 2012 results. Analysts are predicting an EPS of $44.75 this year, but let’s ignore that and continue the low ball valuation.
The expected growth if AAPL earns and EPS of $33.55 is 5.5%.
The image below is a closer look at the valuation and how it can change.
At the current expected growth rate of 5.5%, if AAPL can achieve similar earnings to what it did last year, the value is $600.
If earnings is similar to last year, but growth increased to 8.2%, then AAPL is worth $730 on the high end.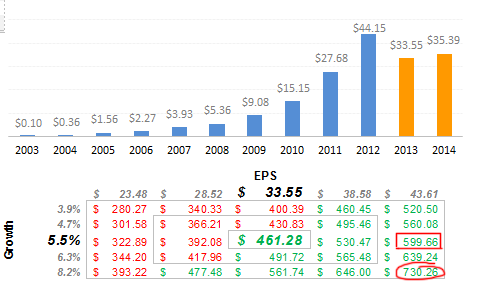
Will AAPL grow earnings faster than 5.5%? Most likely.
Reverse Absolute PE Valuation
Again, remember that all the valuation methods are independent of each other.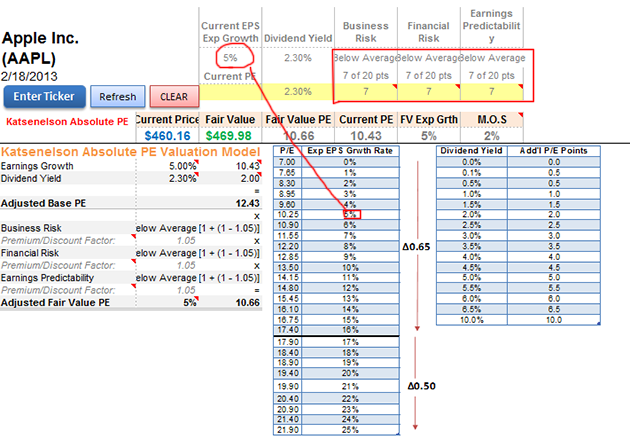
According to the PE to earnings growth correlation table, AAPL’s current PE of 10.4 is equivalent to 5% earnings growth.
Starting with 5%, in order to get the valuation anywhere near the current stock price of $460, I had to lower AAPL’s grades significantly.
In it’s current state, AAPL is below average in every category compared to its peers.
Is AAPL below average compared to competitors? No way.
Reverse Earnings Power Value
EPV is based on zero growth by default so this is an easy exercise.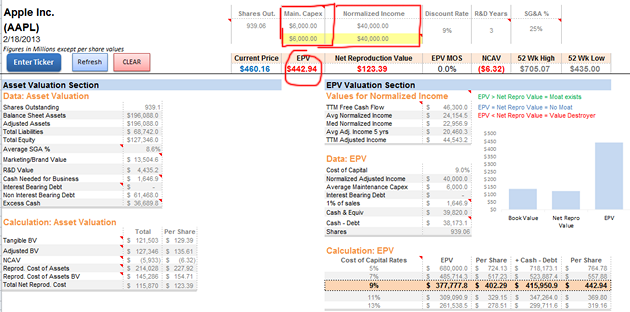
There are only two numbers to be concerned when performing an EPV analysis in reverse.
Find the maintenance capex and what is the normalized income?
AAPL has been increasing its capex each year and maintenance capex is certainly going up with it. I’ve set the maintenance capex level to $6b. Here are the details of how to calculate maintenance capex.
For the normalized income, I low balled it again. The adjustment normalized income is $44b according to my calculations, but I have reduced that down to $40b.
Even when using a higher maintenance capex and lower normalized income, the final EPV comes out to $442.94 which is within 3% of the current price.
This was a long way of saying that AAPL is priced for zero growth.
Summing Up
AAPL is cheap and there is no need to complicate it. Fundamentally, it is extremely cheap by being priced for zero growth.
Zero growth expectations with a bullet proof balance sheet protects the downside and AAPL will have to experience some severe negative growth for it to be a value trap.
Disclosure
Long AAPL at the time of writing.
