Well I hate to repeat myself, but the close of trading on 6/15 signals the start of one of the most consistently bearish seasonal periods in any market. It marks the beginning of a bearish seasonal period for natural gas, which extends through the end of July Trading Day #14 (July 21 in this case).
Figure 1 displays the net performance that a trader would have “achieved” by holding a long position in natural gas futures during this period every year since natural gas futures started trading in 1990 (and let be honest, “achieved” may not be exactly the best choice of words).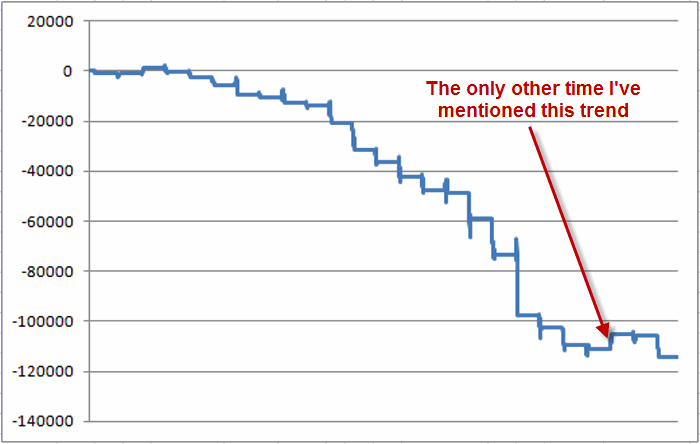
Figure 1 – Long natural gas futures during bearish June/July period (1990-2014)
To note:
*Natural gas lost ground 19 years in a row from 1993 through 2011.
*Natural gas has lost ground in 21 out of the last 22 years during this period
*The one time it showed a significant gain was during the only previous year in which I actually mentioned this trend, 2012 (proving once again that Murphy’s Law is alive and well).
So forget all that, the real question is “what happens this time around?” I can tell you that I have spent (wasted?) a significant amount of time trying to come up with a good “confirming” indicator to help suggest whether the trend will play out as expected during a given year but to no avail. So let’s just consider the trading possibilities.
The Possibilities
So either you put some faith in the fact that natural gas has been down 21 out of 22 years during this period, or you don’t. All of this leads to a variety of possibilities:
*Do Nothing: If you think seasonal trends are not to be trusted then by all means you should simply steer clear. No harm, no foul.
*Short Natural Gas Futures: If you are well capitalized, willing to accept a certain degree of risk (and are not terribly frightened regarding what happened the last time I mentioned this trend, i.e., a sharp rally for natural gas rather than a decline), then the “purest play” is to sell short natural gas futures. But make no mistake, selling short any futures contract involves an above average degree of risk. As I write, July NG futures are trading at roughly $2.800. With NG futures a $0.001 move in price is worth $10. So if a trader sold short a futures contract at $2.800 and NG happened to advance to $3.000, the trader would lose $2,000. So clearly selling short futures contracts is not for the faint of heart nor the under capitalized.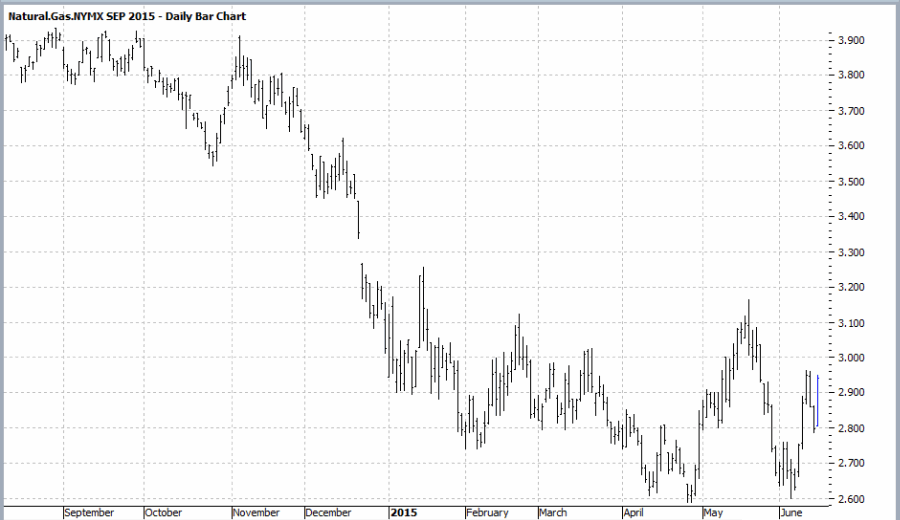
Figure 2 – September Natural Gas Futures (Courtesy: ProfitSource by HUBB)
*Sell Short Shares of UNG: Another choice for non-futures traders is to sell short shares of ticker (ARCA:UNG), the ETF that (ostensibly) tracks the price of natural gas. Selling short shares of any ETF is also generally considered to be a “risky” strategy. There are margin requirements for maintaining the position not to mention that pesky little “unlimited risk” thing associated with selling short. Still, for a trader willing to assume the risks, selling short shares of UNG is a “direct play” on lower natural gas prices.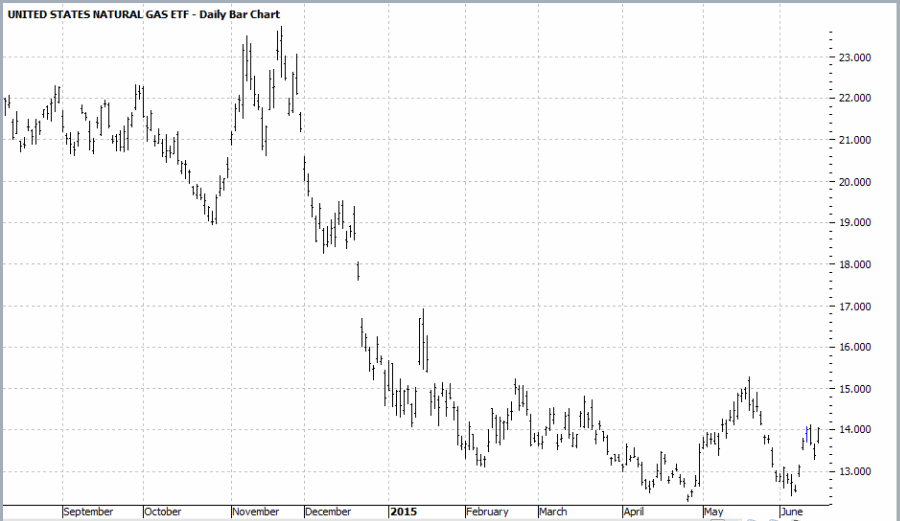
Figure 3 – ETF ticker UNG (Courtesy: ProfitSource by HUBB)
*Buy an Inverse ETF: Ticker (NYSE:DGAZ) is a triple-leveraged inverse ETF that tracks natural gas and trades roughly 9 million shares a day. This sounds like a great choice for playing the bearish side of natural gas, but one needs to consider the potential “bad” along worth the potential “good.” During the June/July “bearish” period in 2014 DGAZ gained +74.9%. However, during the June/July bearish period in 2012 DGAZ lost -53.6%. So if things “go wrong” with a triple-leveraged inverse ETF, things go “very wrong.”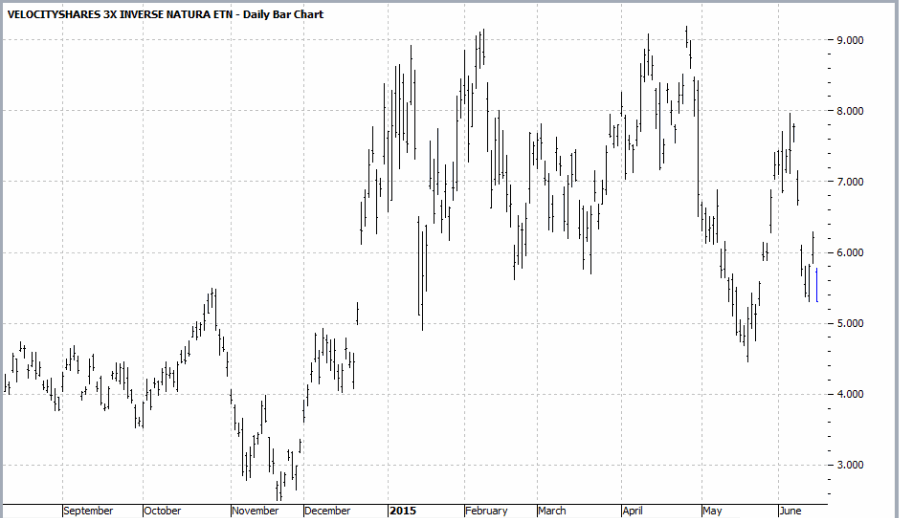
Figure 4 – ETF ticker DGAZ (Courtesy: ProfitSource by HUBB)
*Put puts on UNG: This seems like a natural choice to play a potentially bearish trend. The problem is that UNG options often have relatively wide bid/ask spreads. For example, as I write the July Week 4 14 strike price put trades at $0.66 bid/$0.79 ask. The bottom line is that if you buy a UNG put option and UNG only declines a few percent the trade will probably not make money.
*Use Options “Creatively”: I mentioned in a recent article that traders often need to “get creative” in order to make money during the summer months, so let’s look at one “creative way” to play the short side of natural gas (without the risk associated with selling short futures or ETF shares).
The trade we will consider involves:
*Buying 3 October UNG 13 strike price puts
*Selling 2 July UNG 13 strike price puts
Note: For illustrative purposes we will use a “market order” (i.e., buying at the ask price and selling at the bid price). Because of the width of the bid/ask spreads traders may consider using a limit order instead. But for our purposes we are essentially assuming a “worst case” fill.
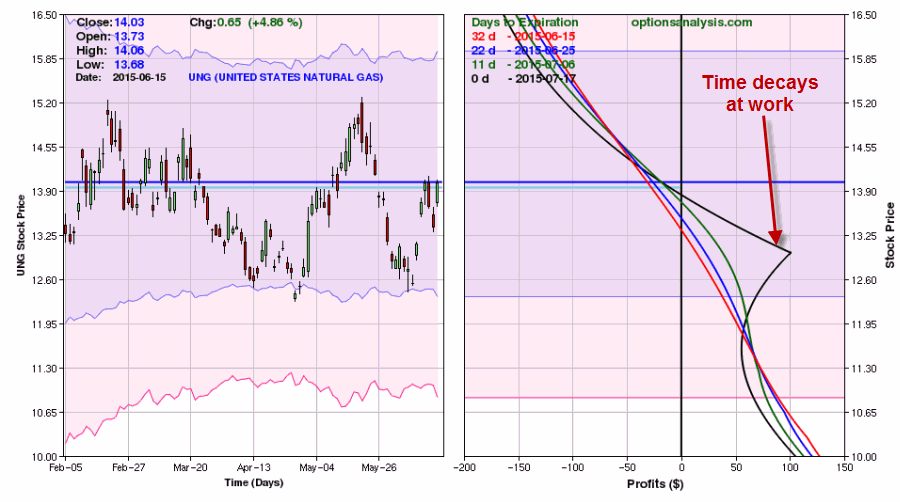
Figure 6 displays the particulars of the trade and Figure 7 displays the risk curves.
Figure 6 – UNG Oct/Jul Directional Bear Put Spread (Courtesy: OptionsAnalysis.com)
Figure 7 – UNG Oct/Jul Directional Bear Put Spread (Courtesy: OptionsAnalysis.com)
Important things to note:
*The key factor in this trade is that fact that the July options will expire on 7/17, i.e., near the end of the bearish period (July 21). This allows time decay to work for us as the July options will lose time premium at an accelerating rate as expiration nears.
*The October puts will not lose time premium as quickly. Note in Figure 2 that the July 13 put shows a Theta of -$0.90 – meaning it will lose roughly $0.90 a day due to time decay; the October 13 put shows a Theta of only -$0.50. This explains the “bulge” in the purple risk curve line in Figure 3. As July expiration draws near, accelerated time decay increases the profit potential.
*By buying in 3×2 ratio we retain unlimited profit potential in the event that natural gas does in fact decline sharply.
*If Murphy decides to invoke his dreaded Law and whack me upside the head again for daring to mention this bearish seasonal trend in natural gas again, the most that this trade can lose by July 21st is $220 (and that is only if UNG rallies roughly 50%; if UNG rises roughly one standard deviation to around $16 a share, the loss on this trade is roughly -$150.
Summary
As always, none of this constitutes a “recommendation”, only “possibilities”. In any event, a trader first must decide if they really want to risk their hard-earned money on a seasonal trend. Then they must decide how they want to go about making the play. As you have seen there are “high risk/high reward” possibilities, and there are other not high risk/high reward ideas.
In most cases I prefer taking a limited risk using a reasonable amount of trading capital and hoping for a high percentage rate of return on the capital invested. What you may choose to do is of course entirely up to you.
But whatever you decide to do, DO NOT breathe a word of this to Murphy…

