China and crude oil are running the show in the financial futures markets.
We aren't saying it is right, or even rational, but it is clearly China's economic data and volatility in crude oil that are in the driver's seat. Data out of China continues to disappoint despite some rather dramatic actions being taken by the country's central bank. We have to admit, we thought the futures markets (commodities and financials) would react more positively by moves made by the People's Bank of China. Instead, investors have taken their stimulus actions as reason to panic.
Crude oil has seen the largest percentage move in over two decades. In fact, we've seen the asset class move more in 4 trading sessions than some commodity markets move in years. In any case, those that have traded crude oil futures know that volatility is par for the course. The problem with oil market volatility is that it bleeds into the financial futures markets. Although yesterday's crude oil rally likely postponed selling the the S&P 500 futures, today's weakness in oil was a good reason for equity traders to hit the sell button.
We suspect things won't start getting back to normal until after the Labor Day weekend. If you are going to get involved with the futures and options markets this week, tread lightly.
Treasury Futures Markets
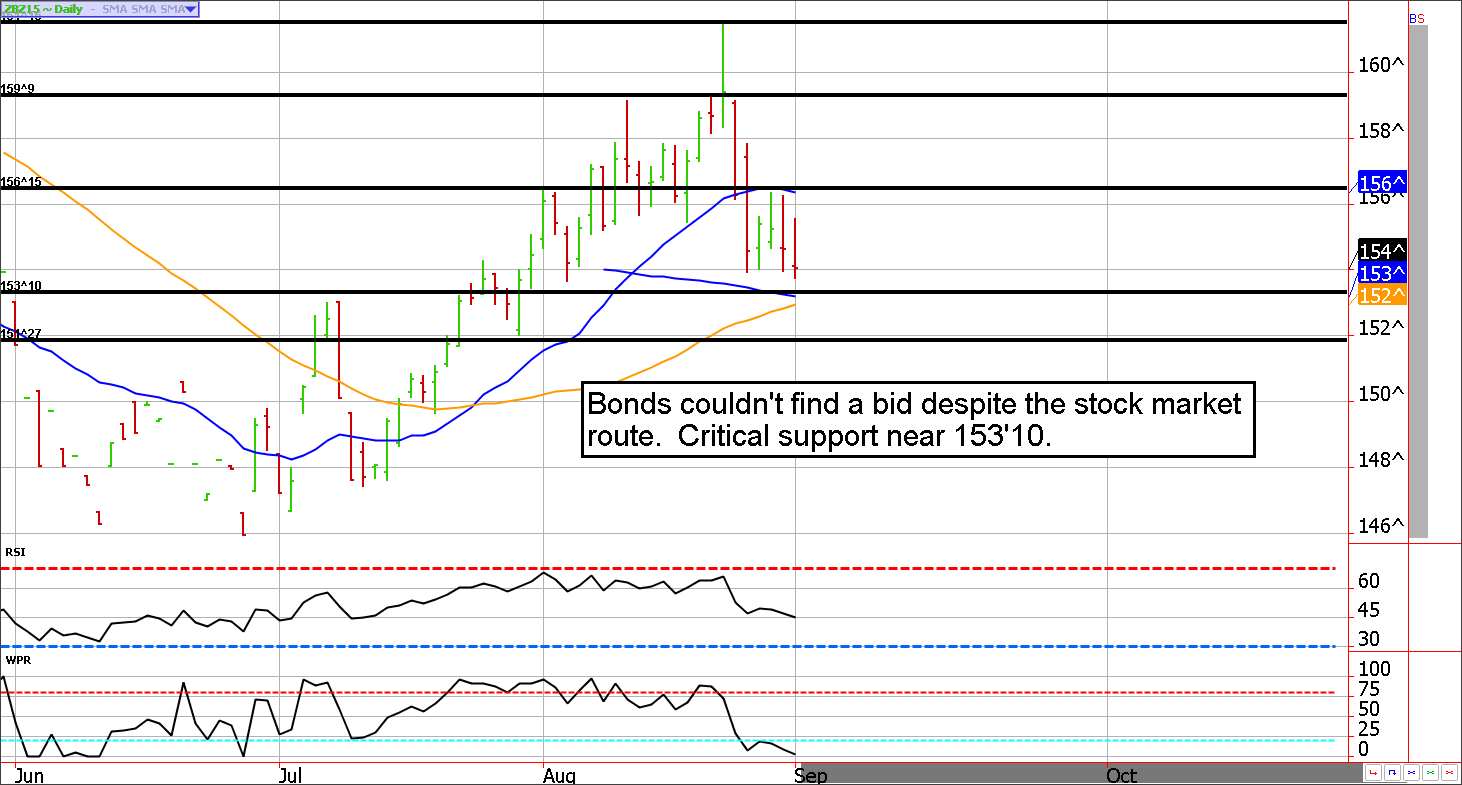
Is the flight to quality being trumped by China's central bank selling of Treasuries? Bond futures fail to budge amid global turmoil.
Last week in this newsletter we were asking ourselves, "If Treasuries are holding their ground in the face of stronger equities, what will they do when the stock rally fizzles?" Much to our dismay, the answer to that is nothing.
It's rather surprising to see the Treasury market hover near unchanged in an environment in which investors are selling index futures with both hands. However, there are some whispers of major selling in U.S. Treasuries by central banks (namely the People's Bank of China). Perhaps, the panic buying by U.S. investors is simply being offset by institutional selling.
Either way, it doesn't give the bulls a lot to hang their hat on. In the meantime, we are going to work with the premise that 153.10ish support in the 30-Year bond should hold (as stocks continue to slide).
Treasury Futures Market Analysis
**Bond Futures Market Consensus:** If 153'10 support holds, we could get another run at 162. A break below gives the bears a hall pass into the high 140s.
**Technical Support:** ZB : 153'10 and 151'27, ZN: 126'24, 125'30, and 125'17
**Technical Resistance:** ZB : 156'15, 159'09, and 161'16 ZN: 128'11 and 129'17
Stock Index Futures
Asian markets sell-off, the e-mini S&P 500 futures follow suit

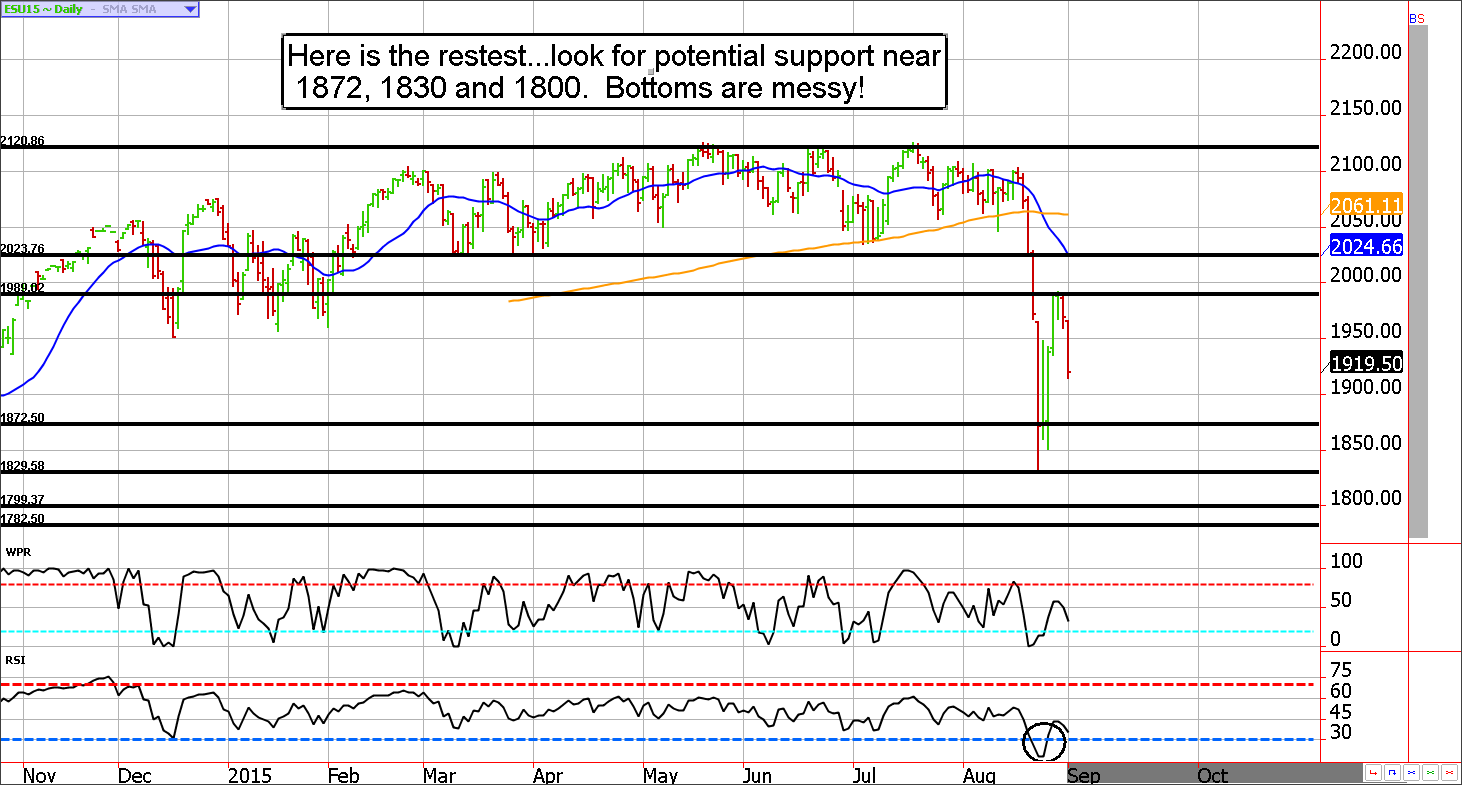
Market bottoms are awfully messy. Although we believe we are in the process of building a base in the e-mini S&P futures, we are likely in store for continued volatility.
Our primary concern regarding the near-term health of stock index futures is the massive bullish position held by small speculators in the e-mini S&P contract. Coming into the current reporting week, the CFTC reported small speculators were net long over 300,000 futures contracts. If you add in the option market speculations, most likely primarily made up of short put options, this group is net long the equivalent of over 330,000 e-mini futures contracts. In our opinion, this signals that speculators are far too comfortable in their assumption that this is a run of the mill correction. With this in mind, we have a feeling the ES futures contract is destined to make a moderately new low.
If we are right about this, the e-mini futures contract should probe into the 1830 to 1800ish area. If see, this should be a level for the bulls to stand their ground.
Stock Index Futures Market Ideas
**e-mini S&P Futures Market Consensus:** We suspect 1830, and maybe even 1800ish will be seen on this move. If so, it could be quick and dirty.
**Technical Support:** 1872, 1830, 1801, and 1782
**Technical Resistance:** 1989, 2023, and 2060.
e-mini S&P Futures Day Trading Ideas
**These are counter-trend entry ideas, the more distant the level the more reliable but the less likely to get filled**
ES Day Trade Sell Levels: 1944, 1965, and 1989
ES Day Trade Buy Levels: 1908, 1876, 1835
In other commodity futures and options markets....
May 14 - Buy an October sugar 1325 call, sell a 1425 call, and then sell a 1225 put. This should be an even money spread, or free trade, but involves margin and unlimited risk below 1225. The max profit is about $1100 before transaction costs.
June 16 - Buy back short October sugar 1425 call (part of spread) to lock in the profit. We'll hold the other legs of the option spread for now (which are under pressure).
June 29 - Go long the Aussie dollar via e-micro futures near 7640ish.
July 6 - Add to the bullish Aussie dollar trade with the purchase of another contract (e-micro for most). This dollar cost averages the position to a more favorable level.
July 21 - Buy December e-micro gold near $1106.
*August 21 - Exit gold futures near 1160 to lock in profit. (Sorry, we were late to update this exit).
August 26 - Sell October eurostrangles using the 120 call and the 108 put, for about 56 ticks or $700.
