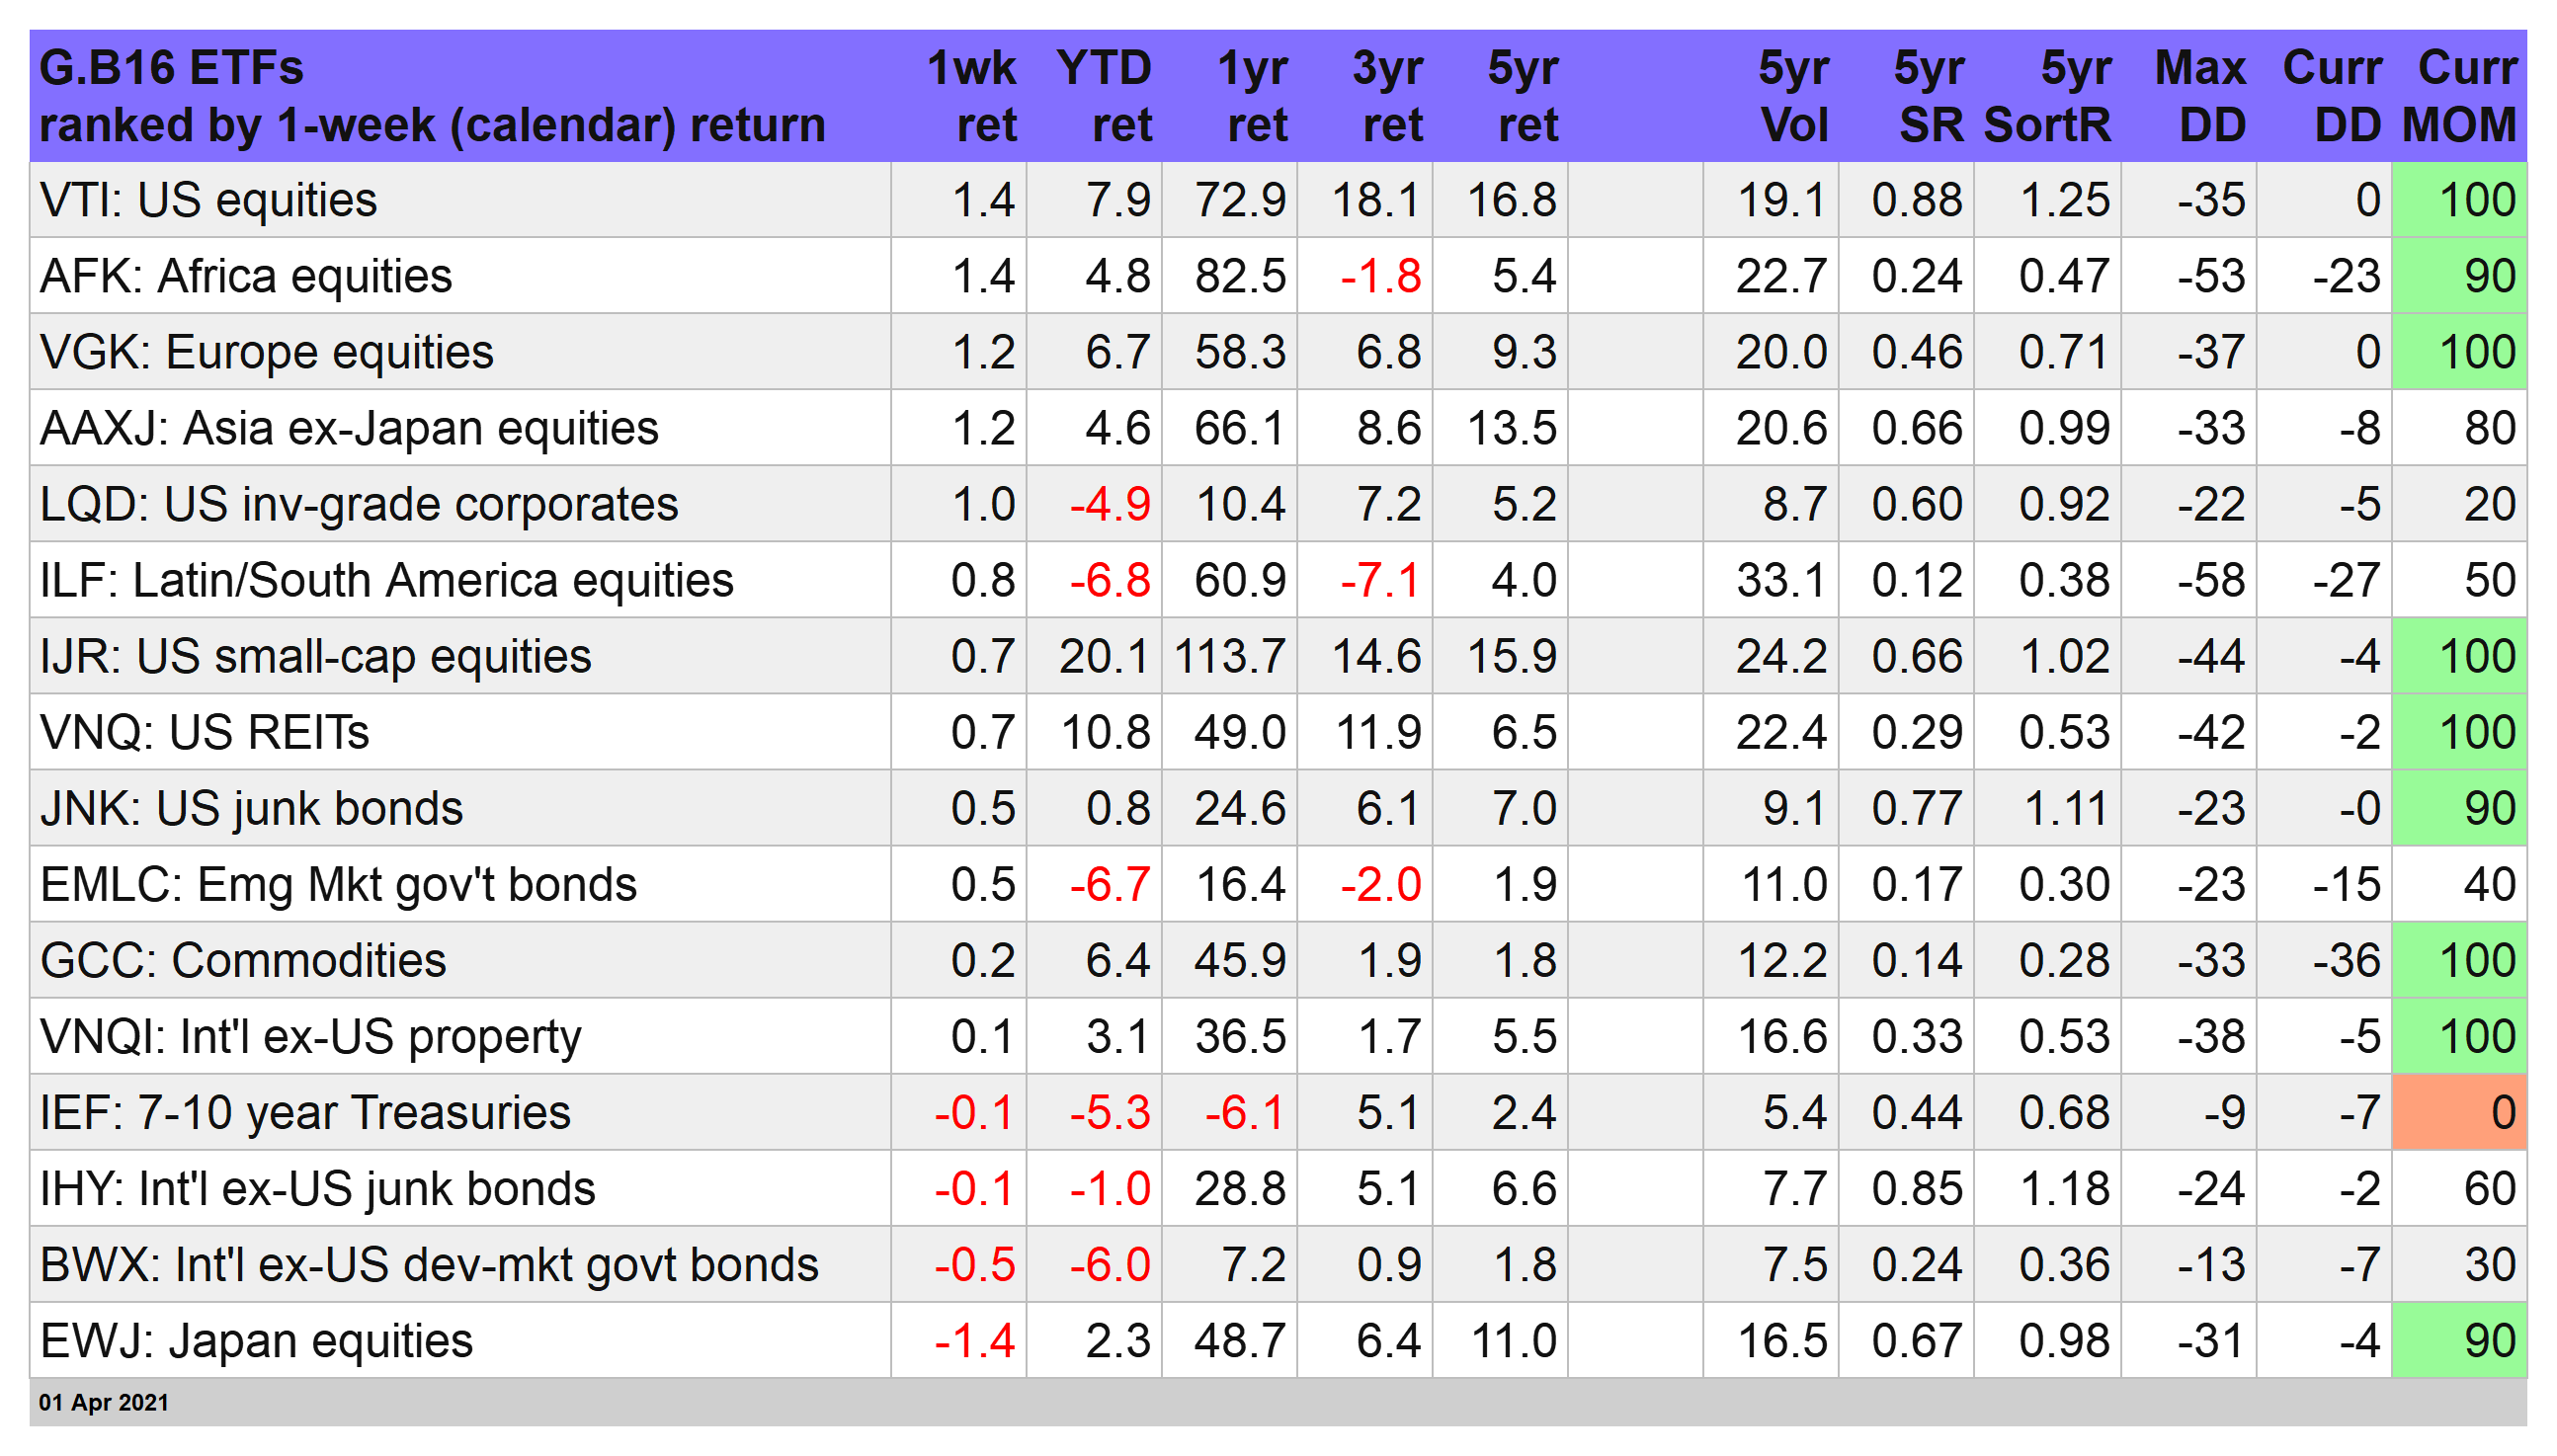
It was had to lose money in stocks this week. Well, almost. Japan’s market slipped. Otherwise, profits were flowing once more for most broad measures of stock markets.
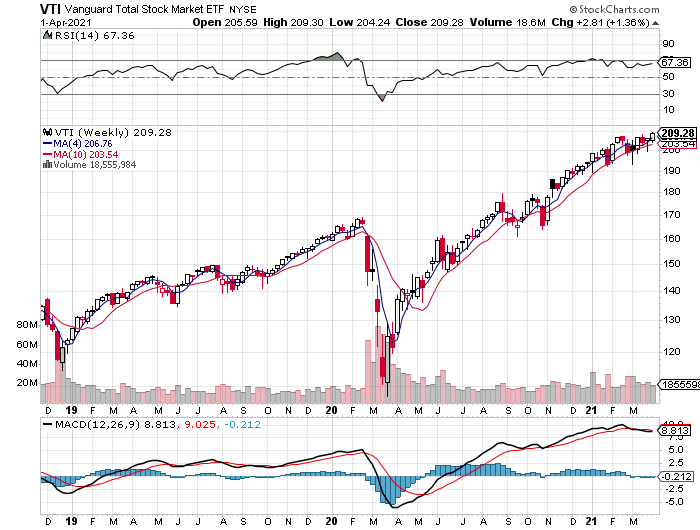
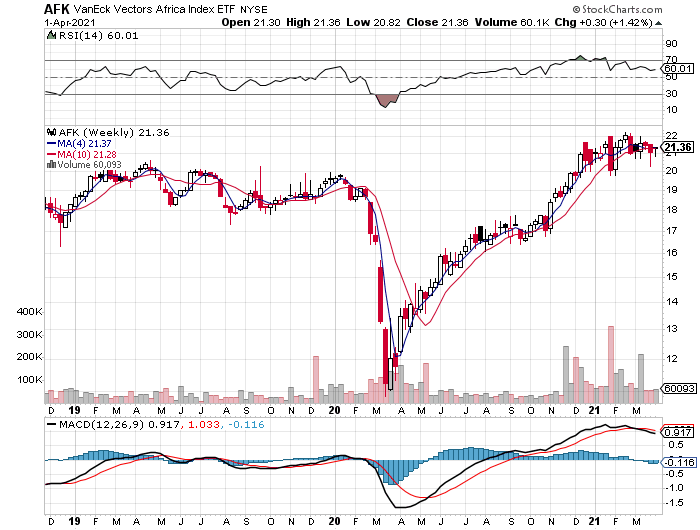
First place for this shortened trading week (through Apr. 1) is effectively a tie between US (VTI) and Africa shares (AFK). Each of these ETFs was up roughly 1.4%. That’s where the similarity ends. Vanguard Total US Stock Market’s rally lifted the price to a new record high.
VanEck Vectors Africa, by contrast, continues to churn in trading range after its late-2020 fizzled this year.
But, wait—there’s more. Signs of life are stirring in the bond market. The iShares iBoxx $ Investment Grade Corporate Bond ETF (NYSE:LQD) posted a second straight weekly gain—the first back-to-back pop this year.
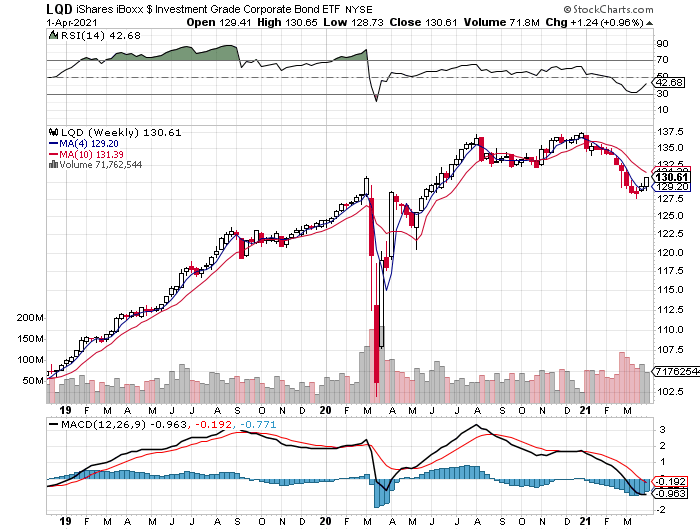
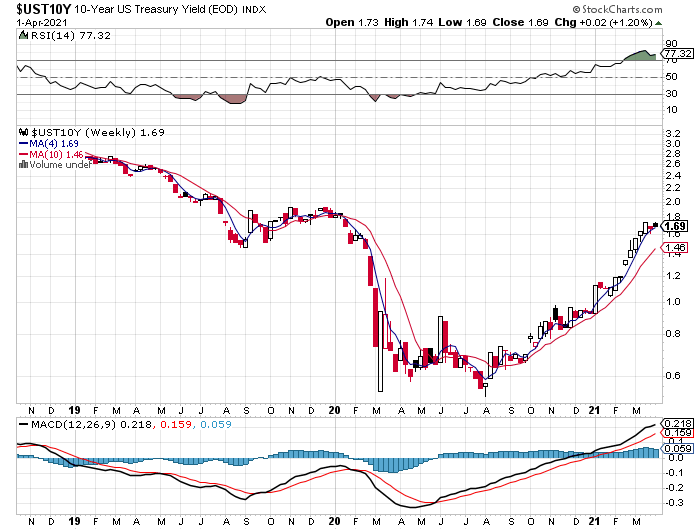
It’s debatable if the bounce in credits will continue. The key question: Will interest rates continue to rise and wreak further havoc across the fixed-income realm? For the moment, there’s a pause in the blood-spilling, even though the benchmark 10-year Treasury yield did inch up this week, ending at 1.69%—close to the highest level in over a year. That’s modestly below the previous high and so the crowd is wondering if yields are set to move sideways or resume the upward trajectory that’s prevailed for much of the past seven months.
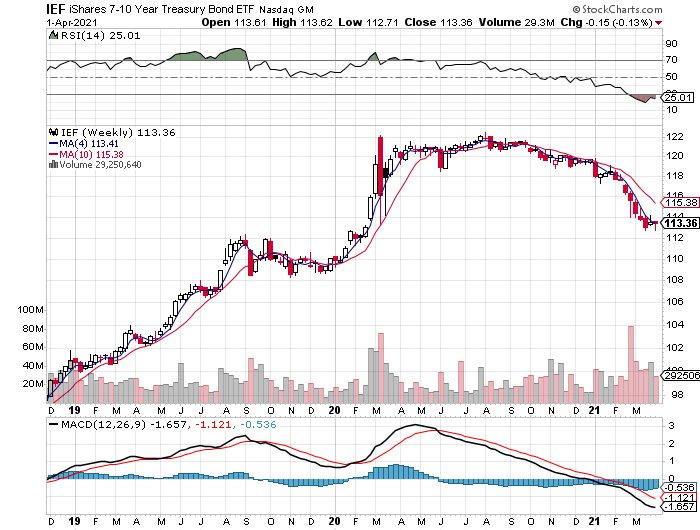
Speaking of Treasuries, our government proxy (IEF) ticked down this week but it’s fair to say it’s still in a trading range, which is a big improvement over the previous trend of suffering significant declines, week after week.
This week’s big loser for our global opportunity set: iShares MSCI Japan (EWJ), which lost 1.4% for the week.
Another solid, weekly gain for our portfolio strategy benchmarks
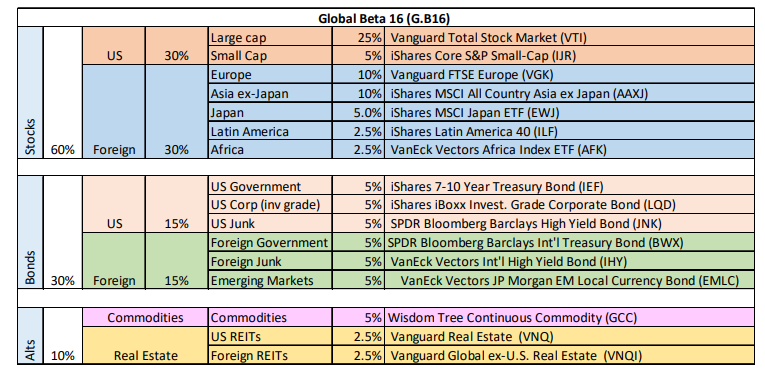
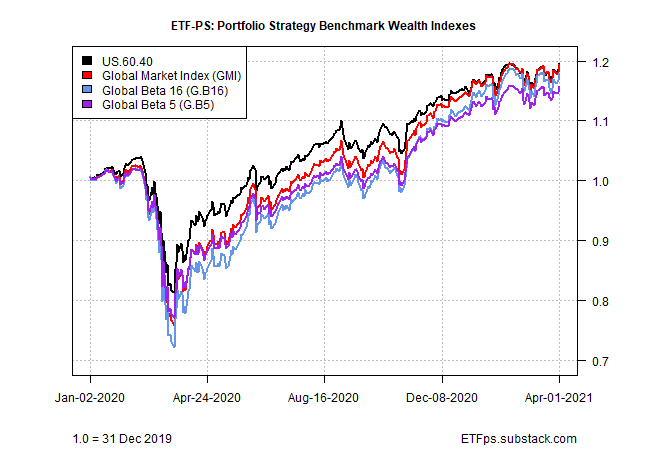
Powered by rallies in most corners of global equity markets, our strategy benchmarks continued to climb. Weekly advances ranged from 0.7% to 0.9%. For details on all the strategy rules and risk metrics, see this summary.

Below the surface calm there’s plenty of drama, but overall the trend is encouraging for the strategy benchmarks. Although all four are still holding in a trading range, this week’s gains suggest that a new upside break to new highs is near.
What could power the strategies higher? Upbeat economic news in the second quarter is on the short list of factors.
Atlanta Federal Reserve Bank President Raphael Bostic is certainly upbeat, advising that “we could see a burst of activity and performance coming into the summer which could lead us to see even more robust recovery. A million jobs a month could become the standard through the summer.”
