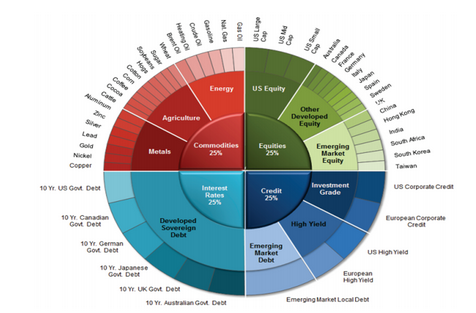
The following graphic is borrowed from a static risk parity approach via Salient Capital Advisors: http://www.theriskparityindex.com/static/pdfs/Salient-Risk-Parity-Index-White-Paper.pdf. The visual is useful for readers to understand the nuances and relative merits of a Cluster Risk Parity (CRP) approach.
In their approach the individual assets and clusters are defined in advance, and thus there is no dynamic clustering method used. However, the concept that they use is similar: balance risk contributions both within and across “clusters” of assets. In this case it is important to clarify that the size/area of each slice of the pie chart is a function of risk contributions NOT percentage capital allocations.
As you can clearly see from this specific chart, it is very similar in spirit to the “All-Weather” Portfolio or even the simpler Permanent Portfolio . The main difference is that the latter portfolio schemes represent “strategic asset allocation” alternatives, while Cluster Risk Parity (and also the Salient Index) is a dynamic asset allocation framework. GestaltU does a good job describing why it is important to prefer dynamic approaches in a recent post Here:
In reference to CRP the advantage is creating a framework that does not require having to pre-specify the assets and weights in advance on a static basis. Instead, it permits the ability for the portfolio to adapt to changes in the variance/covariance matrix of asset returns — which have proven especially useful in a dynamic framework to normalize risk exposure. This framework is so generic that it can be adapted to any type of risk factor or regime framework with relative ease.
- English (UK)
- English (India)
- English (Canada)
- English (Australia)
- English (South Africa)
- English (Philippines)
- English (Nigeria)
- Deutsch
- Español (España)
- Español (México)
- Français
- Italiano
- Nederlands
- Português (Portugal)
- Polski
- Português (Brasil)
- Русский
- Türkçe
- العربية
- Ελληνικά
- Svenska
- Suomi
- עברית
- 日本語
- 한국어
- 简体中文
- 繁體中文
- Bahasa Indonesia
- Bahasa Melayu
- ไทย
- Tiếng Việt
- हिंदी
A Visual Representation Of Cluster Risk Parity
Published 01/06/2013, 01:28 AM
A Visual Representation Of Cluster Risk Parity
Latest comments
Loading next article…
Install Our App
Risk Disclosure: Trading in financial instruments and/or cryptocurrencies involves high risks including the risk of losing some, or all, of your investment amount, and may not be suitable for all investors. Prices of cryptocurrencies are extremely volatile and may be affected by external factors such as financial, regulatory or political events. Trading on margin increases the financial risks.
Before deciding to trade in financial instrument or cryptocurrencies you should be fully informed of the risks and costs associated with trading the financial markets, carefully consider your investment objectives, level of experience, and risk appetite, and seek professional advice where needed.
Fusion Media would like to remind you that the data contained in this website is not necessarily real-time nor accurate. The data and prices on the website are not necessarily provided by any market or exchange, but may be provided by market makers, and so prices may not be accurate and may differ from the actual price at any given market, meaning prices are indicative and not appropriate for trading purposes. Fusion Media and any provider of the data contained in this website will not accept liability for any loss or damage as a result of your trading, or your reliance on the information contained within this website.
It is prohibited to use, store, reproduce, display, modify, transmit or distribute the data contained in this website without the explicit prior written permission of Fusion Media and/or the data provider. All intellectual property rights are reserved by the providers and/or the exchange providing the data contained in this website.
Fusion Media may be compensated by the advertisers that appear on the website, based on your interaction with the advertisements or advertisers.
© 2007-2025 - Fusion Media Limited. All Rights Reserved.
