
I've updated the charts below through Thursday's close. The S&P 500 is now 3.25% off its interim high of 1,465.77 set on September 14th, the day after QE3 was announced. The interim low since then was 1,353.52, a decline of 7.66% a month later on November 15. The 10-year note closed yesterday at 1.74, which is 14 basis points off its interim high of 1.88, also set the day after QE3 was announced. The historic closing low was 1.43 on July 25.
The 2012 Santa Rally peaked on December 18th, with the S&P 500 up 2.16% for the month. By yesterday's close the rally had essentially evaporated, with the index up a fractional 0.14% for the month. It will be interesting to see how yields (and equities) fare in the last two market days of 2012 with the House reconvening on Sunday to address the December 31 Fiscal Cliff.
The latest Freddie Mac Weekly Primary Mortgage Market Survey puts the 30-year fixed at 3.35 percent, four basis point above its historic low set five weeks ago.
Here is a snapshot of selected yields and the 30-year fixed mortgage starting shortly before the Fed announced Operation Twist.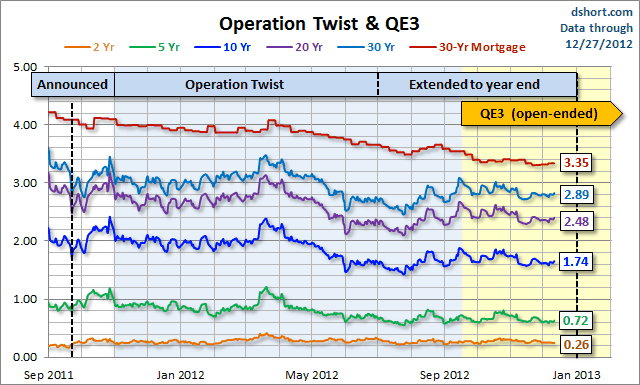
For a eye-opening context on the 30-year fixed, here is the complete Freddie Mac survey data from the Fed's repository. Many first-wave boomers (my household included) were buying homes in the early 1980s. At its peak in October 1981, the 30-year fixed was at 18.63 percent.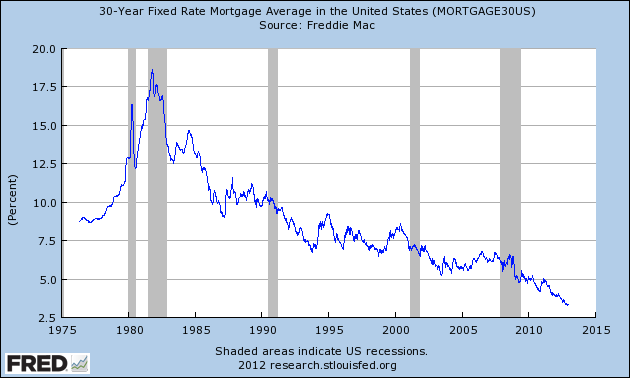
The 30-year fixed mortgage at the current level is a confirmation of a key aspect of the Fed's QE success, and the low yields have certainly reduced the pain of Uncle Sam's interest payments on Treasuries (although the yields are up from recent historic lows of this summer). But, as for loans to small businesses, the Fed strategy is a solution to a non-problem. Here's a snippet from the latest NFIB Small Business Economic Trends report: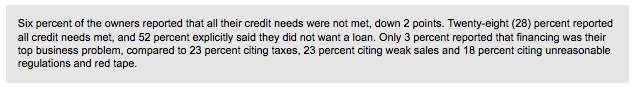
A Perspective on Yields Since 2007
The first chart shows the daily performance of several Treasuries and the Fed Funds Rate (FFR) since 2007. The source for the yields is the Daily Treasury Yield Curve Rates from the U.S. Department of the Treasury and the New York Fed's website for the FFR.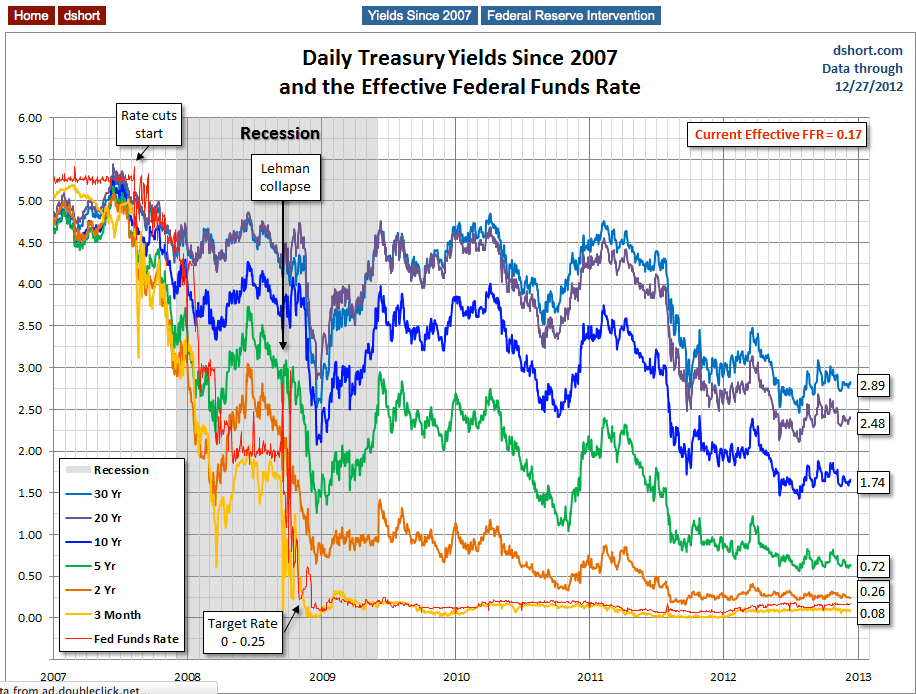
Now let's see the 10-year against the S&P 500 with some notes on Fed intervention.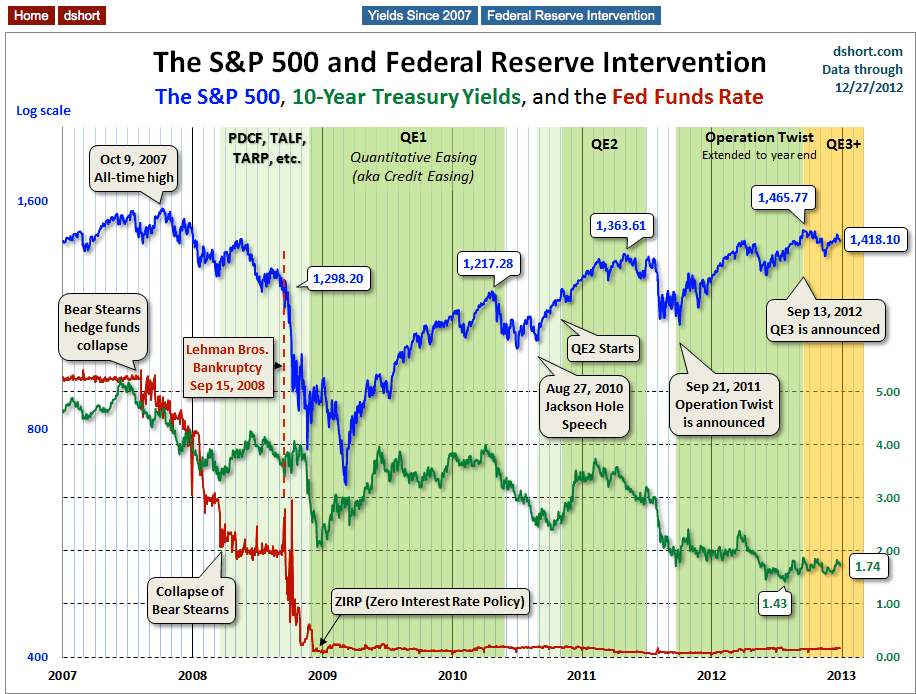
For a long-term view of weekly Treasury yields, also focusing on the 10-year, see my Treasury Yields in Perspective.
- English (UK)
- English (India)
- English (Canada)
- English (Australia)
- English (South Africa)
- English (Philippines)
- English (Nigeria)
- Deutsch
- Español (España)
- Español (México)
- Français
- Italiano
- Nederlands
- Português (Portugal)
- Polski
- Português (Brasil)
- Русский
- Türkçe
- العربية
- Ελληνικά
- Svenska
- Suomi
- עברית
- 日本語
- 한국어
- 简体中文
- 繁體中文
- Bahasa Indonesia
- Bahasa Melayu
- ไทย
- Tiếng Việt
- हिंदी
A Treasury-Yield Snapshot
Latest comments
Loading next article…
Install Our App
Risk Disclosure: Trading in financial instruments and/or cryptocurrencies involves high risks including the risk of losing some, or all, of your investment amount, and may not be suitable for all investors. Prices of cryptocurrencies are extremely volatile and may be affected by external factors such as financial, regulatory or political events. Trading on margin increases the financial risks.
Before deciding to trade in financial instrument or cryptocurrencies you should be fully informed of the risks and costs associated with trading the financial markets, carefully consider your investment objectives, level of experience, and risk appetite, and seek professional advice where needed.
Fusion Media would like to remind you that the data contained in this website is not necessarily real-time nor accurate. The data and prices on the website are not necessarily provided by any market or exchange, but may be provided by market makers, and so prices may not be accurate and may differ from the actual price at any given market, meaning prices are indicative and not appropriate for trading purposes. Fusion Media and any provider of the data contained in this website will not accept liability for any loss or damage as a result of your trading, or your reliance on the information contained within this website.
It is prohibited to use, store, reproduce, display, modify, transmit or distribute the data contained in this website without the explicit prior written permission of Fusion Media and/or the data provider. All intellectual property rights are reserved by the providers and/or the exchange providing the data contained in this website.
Fusion Media may be compensated by the advertisers that appear on the website, based on your interaction with the advertisements or advertisers.
© 2007-2025 - Fusion Media Limited. All Rights Reserved.