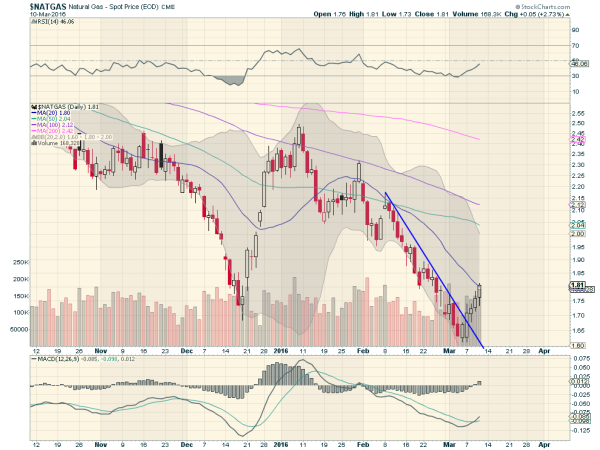
Natural Gas ended 2015 with a burst higher. It rose nearly 50% in less than a month from mid December until mid January. But that move flamed out quickly. Over the next 2 months not only did it retrace the entire move, but it kept going. In the end it made a lower low last week.
But there are signs that the current bounce leg might be a bit different. At least for a short while. Take a look at the chart below. The first thing to note is that the price moved through the falling trend line and then quickly to the 20-day SMA. The 20-day SMA has been a point of inflection, plus or minus a little bit, for quite some time. Continuation could make this time different.

There is support form more upside as well. The momentum indicators are not only rising, but from higher lows. The MACD has crossed up as well and the RSI is nearing the mid line. Continuation does not see any real resistance until the upper Bollinger Band® and that is a better than 10% return from current prices. A major flare up could see 2.20 or 2.35. Maybe it is time to test this reversal in Natural Gas.
