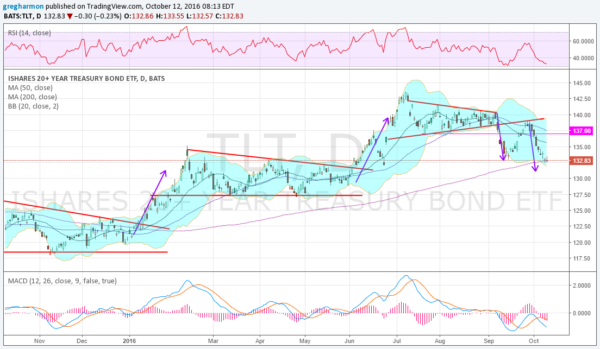
The past twelve months have been an interesting time for US Treasury Bond investors. During that time there, has been an overhanging view that the Federal Reserve will raise rates as a next policy move. But what has happened to US Treasury prices? They have continued to march higher.
Treasuries, as measured here by the ETF TLT, ended 2015 consolidating in a triangle pattern. As 2016 started, they moved higher, quickly reaching the measured move. Then more consolidation. Another descending triangle pattern held in place until the end of May. Then they broke to the upside again, reaching their measured move target by the end of June. A third consolidation followed, this time in a symmetrical triangle.
The break of the triangle to the downside in early September got many thinking that the end of the 30-year bull market run in bonds was at hand. They may be right. But after reaching the measured move to the downside, bond prices bounced. They rose back to test the prior triangle breakdown level. This time it acted as resistance and prices fell back. This set up a Negative RSI Reversal, with a higher high in the RSI but a lower high in price, which gives a target to the downside of about 131 on the TLT. It is almost there as it sits at the 200-day SMA.
Technically, this price level and target are a very big deal. A lower low and a break below the 200-day SMA will turn many more holders bearish. The next major support levels will then stand at the bases of the prior triangles at 127 and 118.50. That is a long way lower, but it will likely take a move below that to fully shake out long-term bulls in the bond market.

