The 2014/2015 Soybean chart strongly suggests a decline to $7.50 and lower
[Note: Factor LLC is a proprietary trading and research firm dating back to 1981 at the Chicago Board of Trade. Since inception, Factor LLC has traded its own capital using classical charting principles. Sometimes the charts are right — sometimes they are wrong. But when a large weekly chart pattern presents itself in the grain markets, traders, farmers and ag businesses must be alert for the possibility indicated by the chart.]
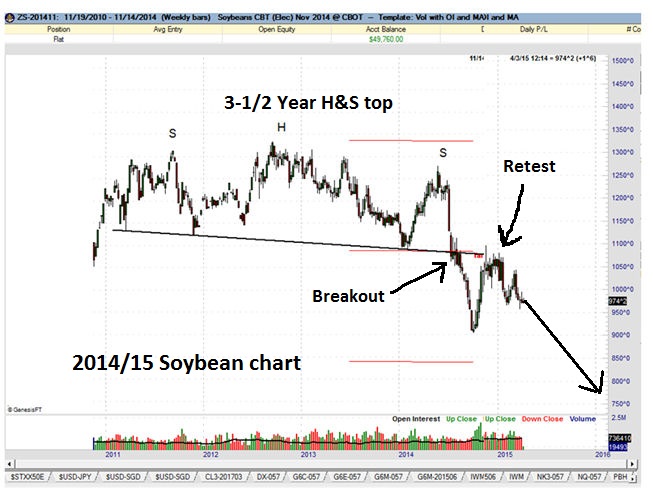
Factor LLC has created a proxy chart for the 2014/2015 Soybean crop year by splicing together the life-of-contract graph of the expired 2014 November Soybean contract with successive delivery months.
The picture is not pretty. Farmers….ignore it at your own risk!
The proxy old-crop Soybeans chart completed a massive 3-1/2 year H&S top in mid-July 2014. The market then drifted sideways until late August before dropping sharply to the $9.04. Soybeans then rallied into a mid-November retest of the neckline of the H&S top. The July 2015 contract is presently about $1 lower than the mid-November high.

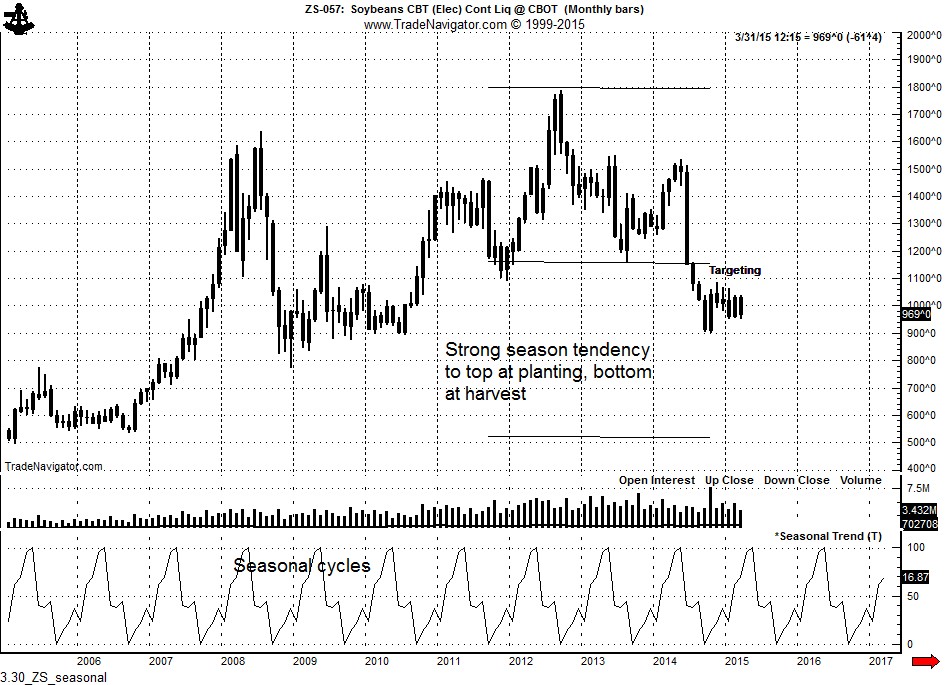
Factor LLC believes the Bean market is just buying time before a sizable decline. There is a strong seasonal tendency for Soybean prices to top when planting is complete and bottom when the crop is in the bin. The seasonal tendency should exert some upward or sideways pressure through early to mid May. Farmers should use any strength during the next six weeks to sell old crop Soybeans and hedge new crop Beans. The pattern target of this H&S top to $8.25. The swing target is to $7.25.

Of course, farmers will say to themselves and each other…
“No way can Beans go to $8.25 much less $7.25. Beans have averaged $12 (at the CBOT) for seven years and I cannot make money at $8. Besides, I have $1 million in new equipment to pay for. “
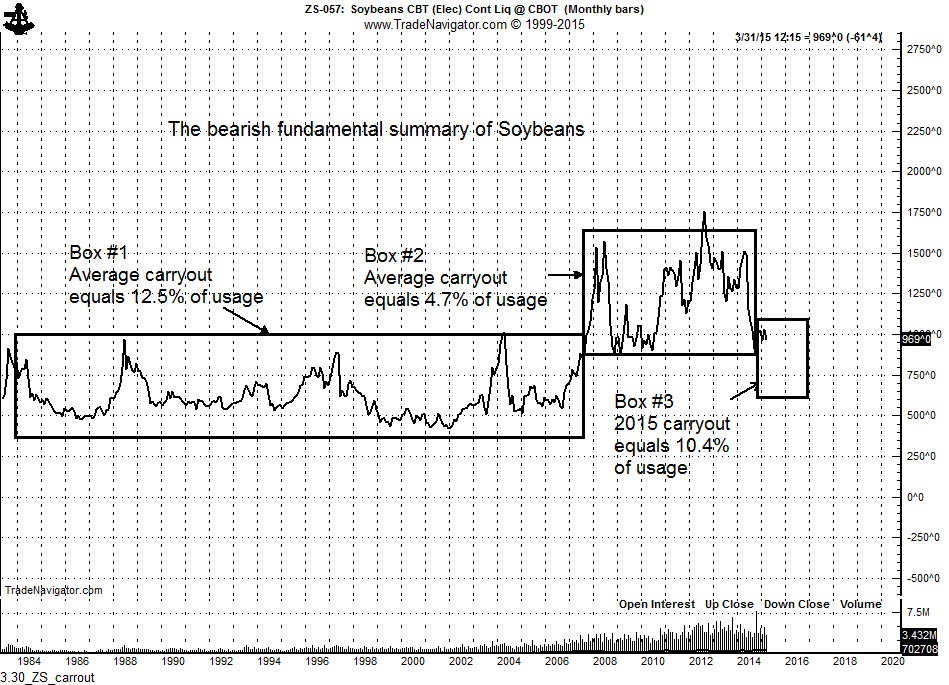
Unfortunately, the market could care less about the cost of production in the short term. The chart below tells a real story. From 1983 through 2007 the average carryout-to-usage ratio of Soybeans was 12.5% — prices at the Board averaged just north of $6.50. The past seven years have been historic, with an average carryout-to-usage ratio of 4.7%. This is why prices have been high since 2007 — and the only reason. The USDA projected carryout-to-usage ratio for the 2014/2015 old crop Beans is 10.4%. But there is more bad news. The current Soybean/Corn ratio is 2.6 to 1. This will encourage farmers to plant even more acres to Beans than were reported today –setting up another record harvest in the fall.

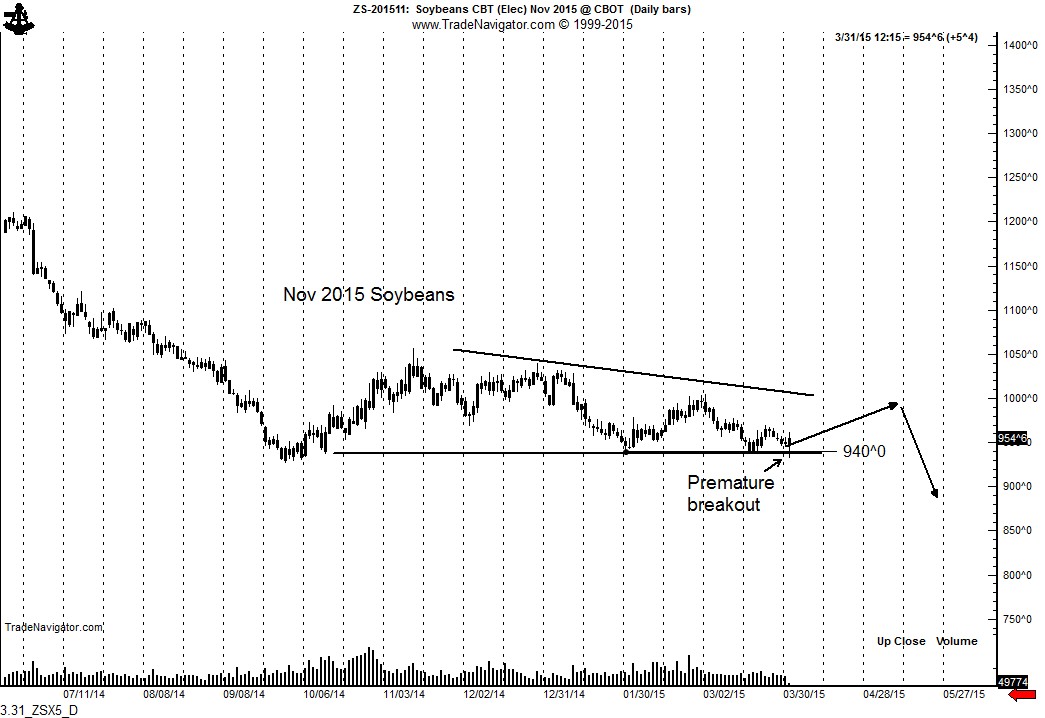
The chart of the November 2015 Soybean contract exhibits a descending triangle. There is room for prices to rally toward $9.80 to $10 to fill out this triangle. The spike down on Tuesday after the planting intentions report no doubt trapped some short sellers. A rally will be needed to wear out the premature bears. Will prices play out as I have marked on the chart? Probably not, but it is something to watch for.

I have no desire to be short futures at this time. I will watching this market for a shorting opportunity. A decisive close below 940 would be such an opportunity.
Disclosure: The information in this blog post represents my own opinions and does not contain a recommendation for any particular security or investment. I or my affiliates may hold positions or other interests in securities mentioned in the Blog, please see my Disclaimer page for my full disclaimer.
