A Strangely Successful Gold Stock Model

Published 03/16/2020, 01:27 AM
Updated 07/09/2023, 06:31 AM
HUI
-
GDX
-

In TSI commentaries since May-June last year I have been tracking the current performance of the gold mining sector with its performance during the mid-1980s. More specifically, I have been comparing the current HUI with the mid-1980s Barrons Gold Mining Index (BGMI). The chart that illustrates this model is displayed below.

The model predicted the rapid rise in the HUI during June-August of last year, the steep correction from a peak by early-September to an October-November low, the rise to a new multi-year high by January-2020 and the crash to a low in March-2020. The big predictions associated with this model are now in the past, which is why I can take the liberty of including it in a free blog post.
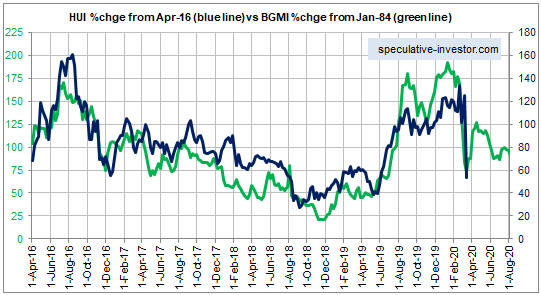
HUI/BGMI % Change Chart

The main point I want to make with this post is that even though the present often looks very different from any previous time, the bulk of what happens in the financial markets has happened before. It’s often just a matter of finding the right historical comparison, which is always easier said than done. Also, valid comparisons with previous times always have limited lifespans. It’s possible, for example, that my comparison with the mid-1980s has almost reached the end of its useful life.

Knowledge of how markets have performed in the past, including the distant past (not just the preceding 10-20 years), is useful even if it doesn’t lead to a specific history-based model. For example, anyone with knowledge of market history knows that when the gold mining sector is stretched to the upside near the start of a general stock market crash, it always crashes with the broad market. As far as I know, there have been no exceptions.

History informs us that after a crash comes a rebound and after a rebound there is usually a test of the crash low.

Latest comments

Loading next article…
Risk Disclosure: Trading in financial instruments and/or cryptocurrencies involves high risks including the risk of losing some, or all, of your investment amount, and may not be suitable for all investors. Prices of cryptocurrencies are extremely volatile and may be affected by external factors such as financial, regulatory or political events. Trading on margin increases the financial risks.
Before deciding to trade in financial instrument or cryptocurrencies you should be fully informed of the risks and costs associated with trading the financial markets, carefully consider your investment objectives, level of experience, and risk appetite, and seek professional advice where needed.
Fusion Media would like to remind you that the data contained in this website is not necessarily real-time nor accurate. The data and prices on the website are not necessarily provided by any market or exchange, but may be provided by market makers, and so prices may not be accurate and may differ from the actual price at any given market, meaning prices are indicative and not appropriate for trading purposes. Fusion Media and any provider of the data contained in this website will not accept liability for any loss or damage as a result of your trading, or your reliance on the information contained within this website.
It is prohibited to use, store, reproduce, display, modify, transmit or distribute the data contained in this website without the explicit prior written permission of Fusion Media and/or the data provider. All intellectual property rights are reserved by the providers and/or the exchange providing the data contained in this website.
Fusion Media may be compensated by the advertisers that appear on the website, based on your interaction with the advertisements or advertisers.
© 2007-2025 - Fusion Media Limited. All Rights Reserved.